

Audit Log
Introduction
Section titled “Introduction”What is the Audit Log?
Section titled “What is the Audit Log?”The Audit Log records the consequential actions that happen across Testver — sign-ins, configuration changes, data mutations, file edits, defect status changes, and more. It is the system’s memory of who did what, and when, and it is how you answer questions such as:
- “Who deleted that test plan?”
- “When was the JIRA token last rotated?”
- “Did anyone change the configuration in the last 24 hours?” Each entry is a compact, structured fact: an action type, the user who performed it, the resource it touched, a timestamp, and — for some entries — an expandable block of details.
Who this guide is for
Section titled “Who this guide is for”- Admins performing routine security hygiene or investigating an incident.
- Compliance and security stakeholders who need an exportable trail of changes.
- Team leads answering “what changed and who changed it?” after an unexpected result.
Key terms
Section titled “Key terms”| Term | What it means |
|---|---|
| Event | A single recorded action — one row in the log. |
| Action | The type of event. Stored as a dotted key such as auth.login and shown in readable form — Auth Login, Run Start, Settings Auto Heal Update. |
| User | Who performed the action, shown as @username. Calls made through CI/CD Pipelines show the CI token instead, e.g. @CI token “LocalRun”. |
| Resource | What the action affected — a test case, a plan, a connector, a setting, and so on. |
| Details | An optional JSON payload attached to an entry, shown when you expand the row. |
| Redacted | Sensitive values (such as API keys) are recorded as placeholders, never in clear text. |
The guiding principle: actions, not content
Section titled “The guiding principle: actions, not content”The Audit Log records actions, not content. The design rule is simple: capture enough information to investigate, but never enough to leak personal data. You will always be able to see that something happened and who did it — but the log deliberately does not store what users typed, recorded, or generated.
Getting Started
Section titled “Getting Started”Opening the Audit Log
Section titled “Opening the Audit Log”- Sign in as an Admin or the Super admin.
- In the Admin group of the sidebar, choose Audit Log.
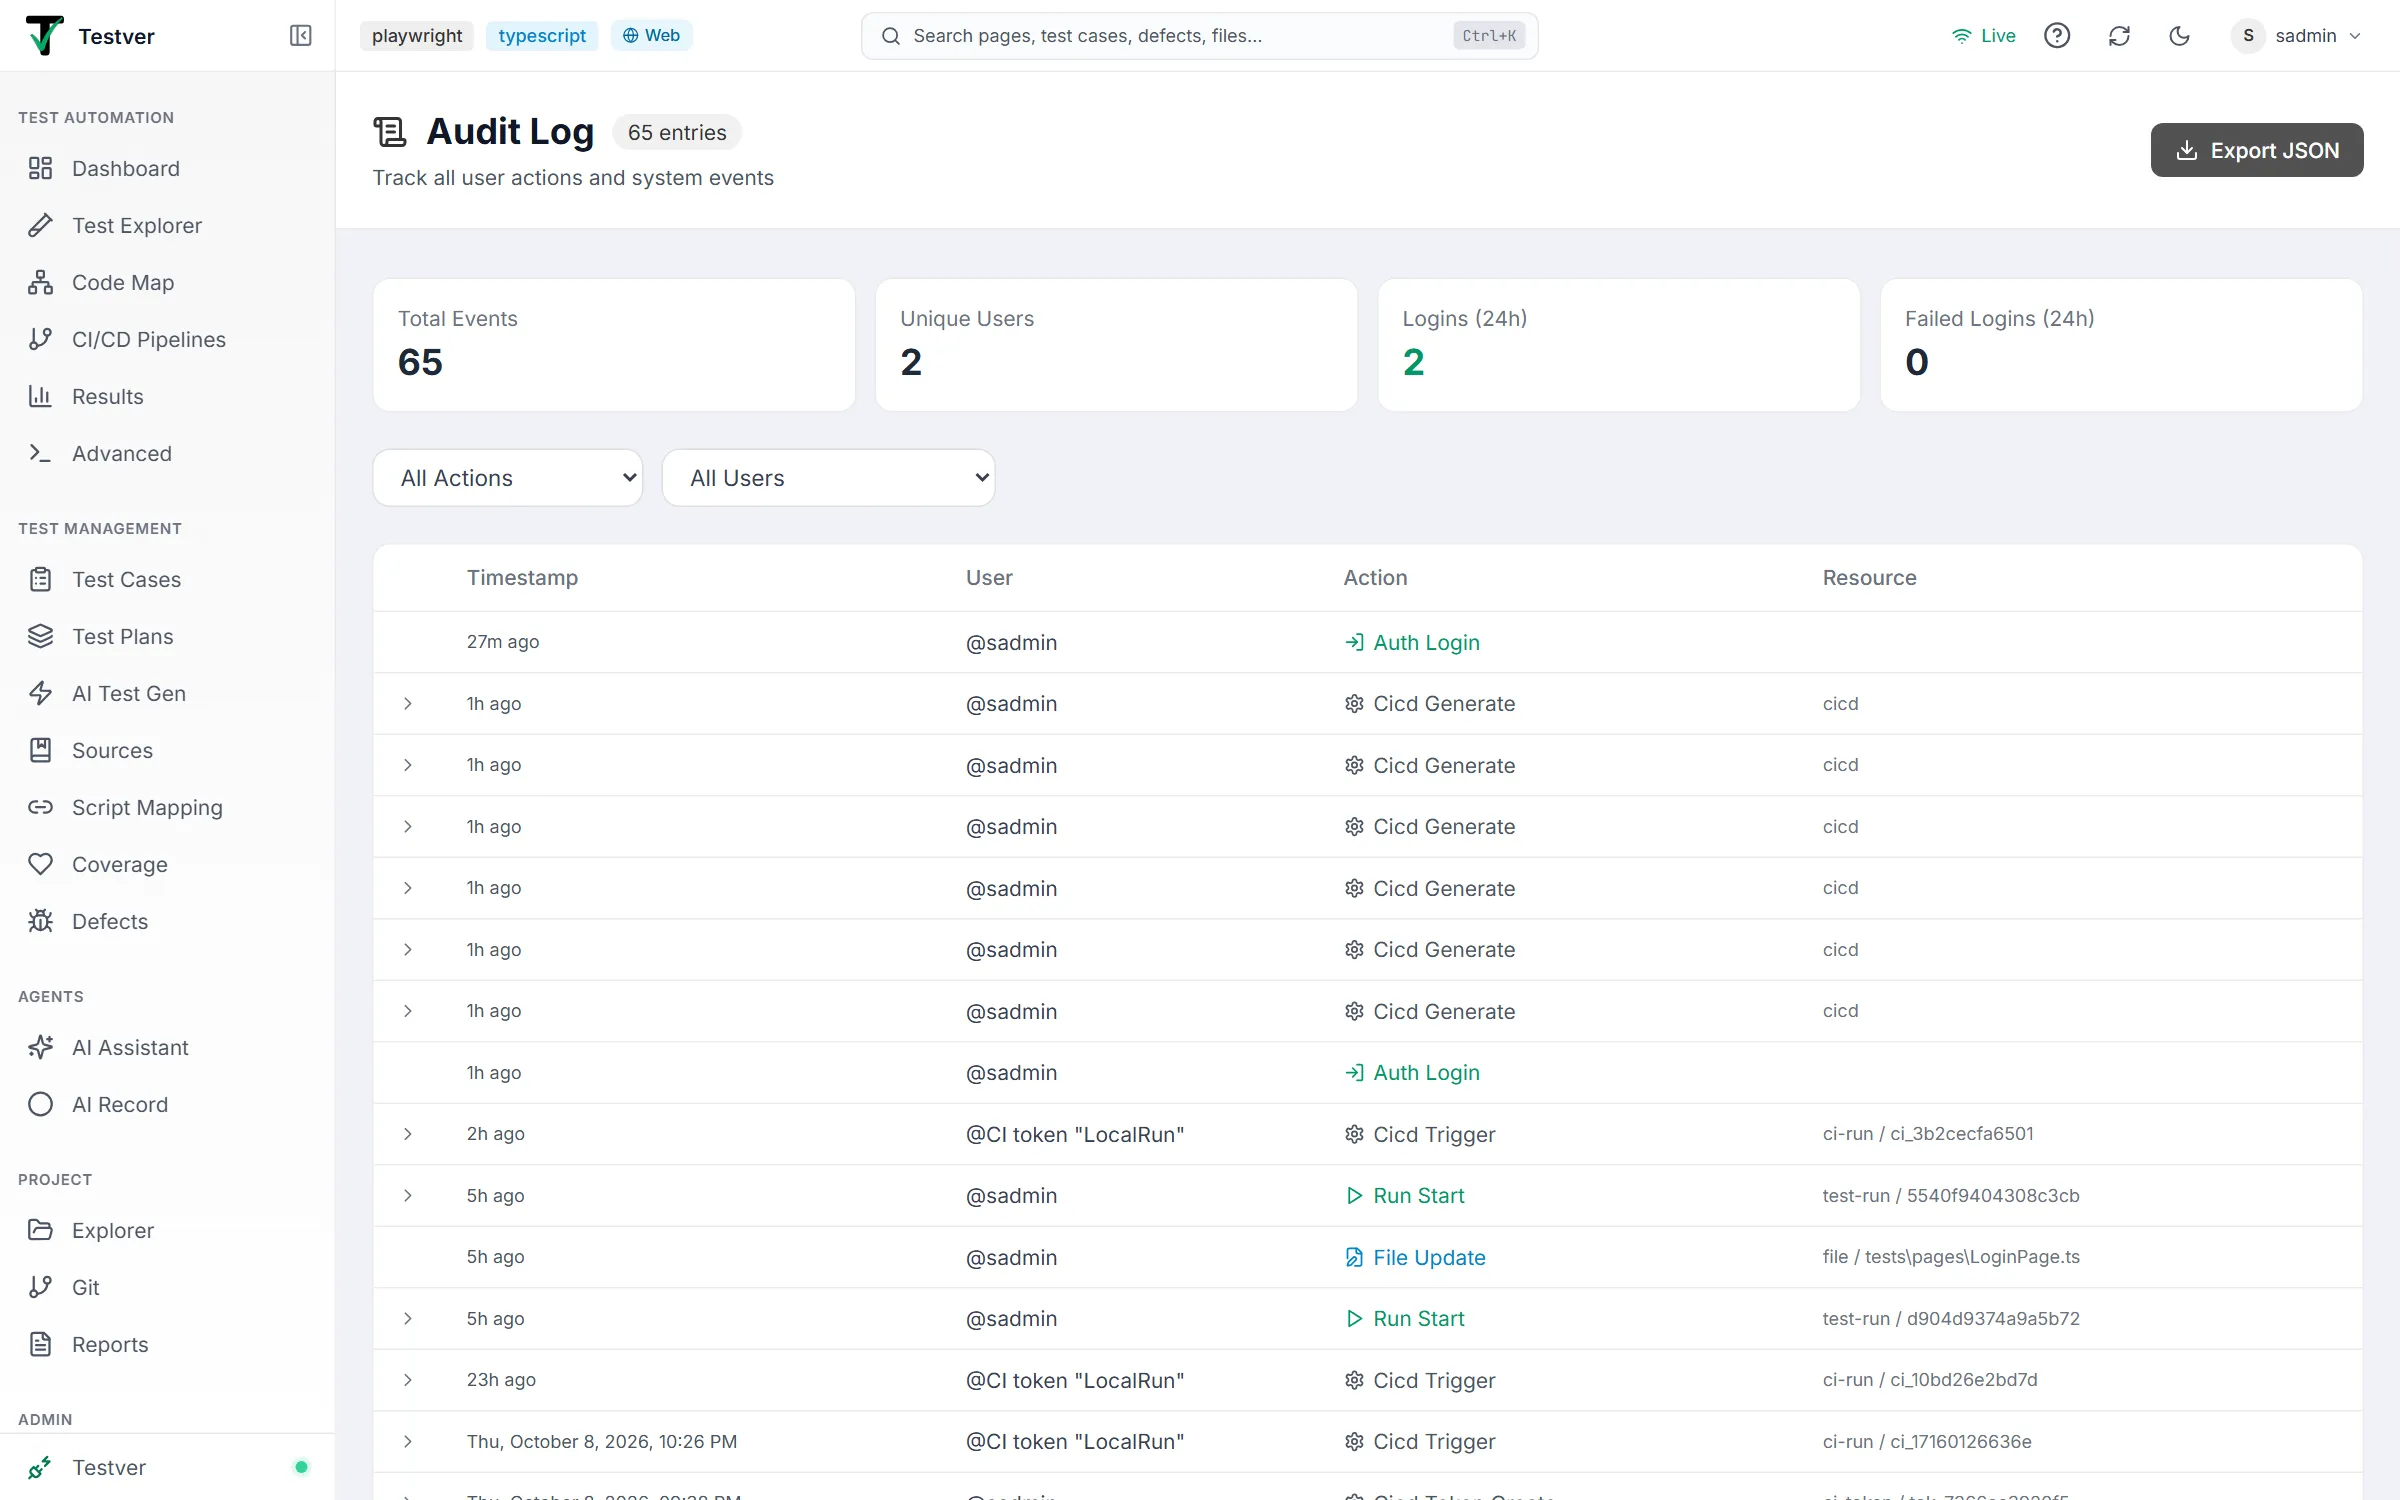
- The audit stream loads, newest events first. The header shows Audit Log with a count badge (e.g. 64 entries), the subtitle Track all user actions and system events, and the Export JSON button.
The screen layout
Section titled “The screen layout”Audit Log is a single-screen stream made of four parts, top to bottom:
- Header stats — quick summary cards.
- Filters — narrow the stream by action type and user.
- Log table — the events themselves, paginated.
- Per-row expansion — additional details for entries that have them.
Header stats
Section titled “Header stats”Four stat cards run across the top of the screen, giving an instant security snapshot:

| Card | What it shows | Why it matters |
|---|---|---|
| Total events | Count across the whole audit history. | A sense of overall activity volume. |
| Unique users | Distinct users who appear in the log. | How many people have actually done something. |
| Logins (24h) | Successful sign-ins in the last day. | Normal daily access baseline. |
| Failed logins (24h) | Failed sign-in attempts in the last day. | Shown in red when non-zero — a first signal of brute-force or probing activity. |
Filters
Section titled “Filters”Two filters sit above the table and combine with each other:
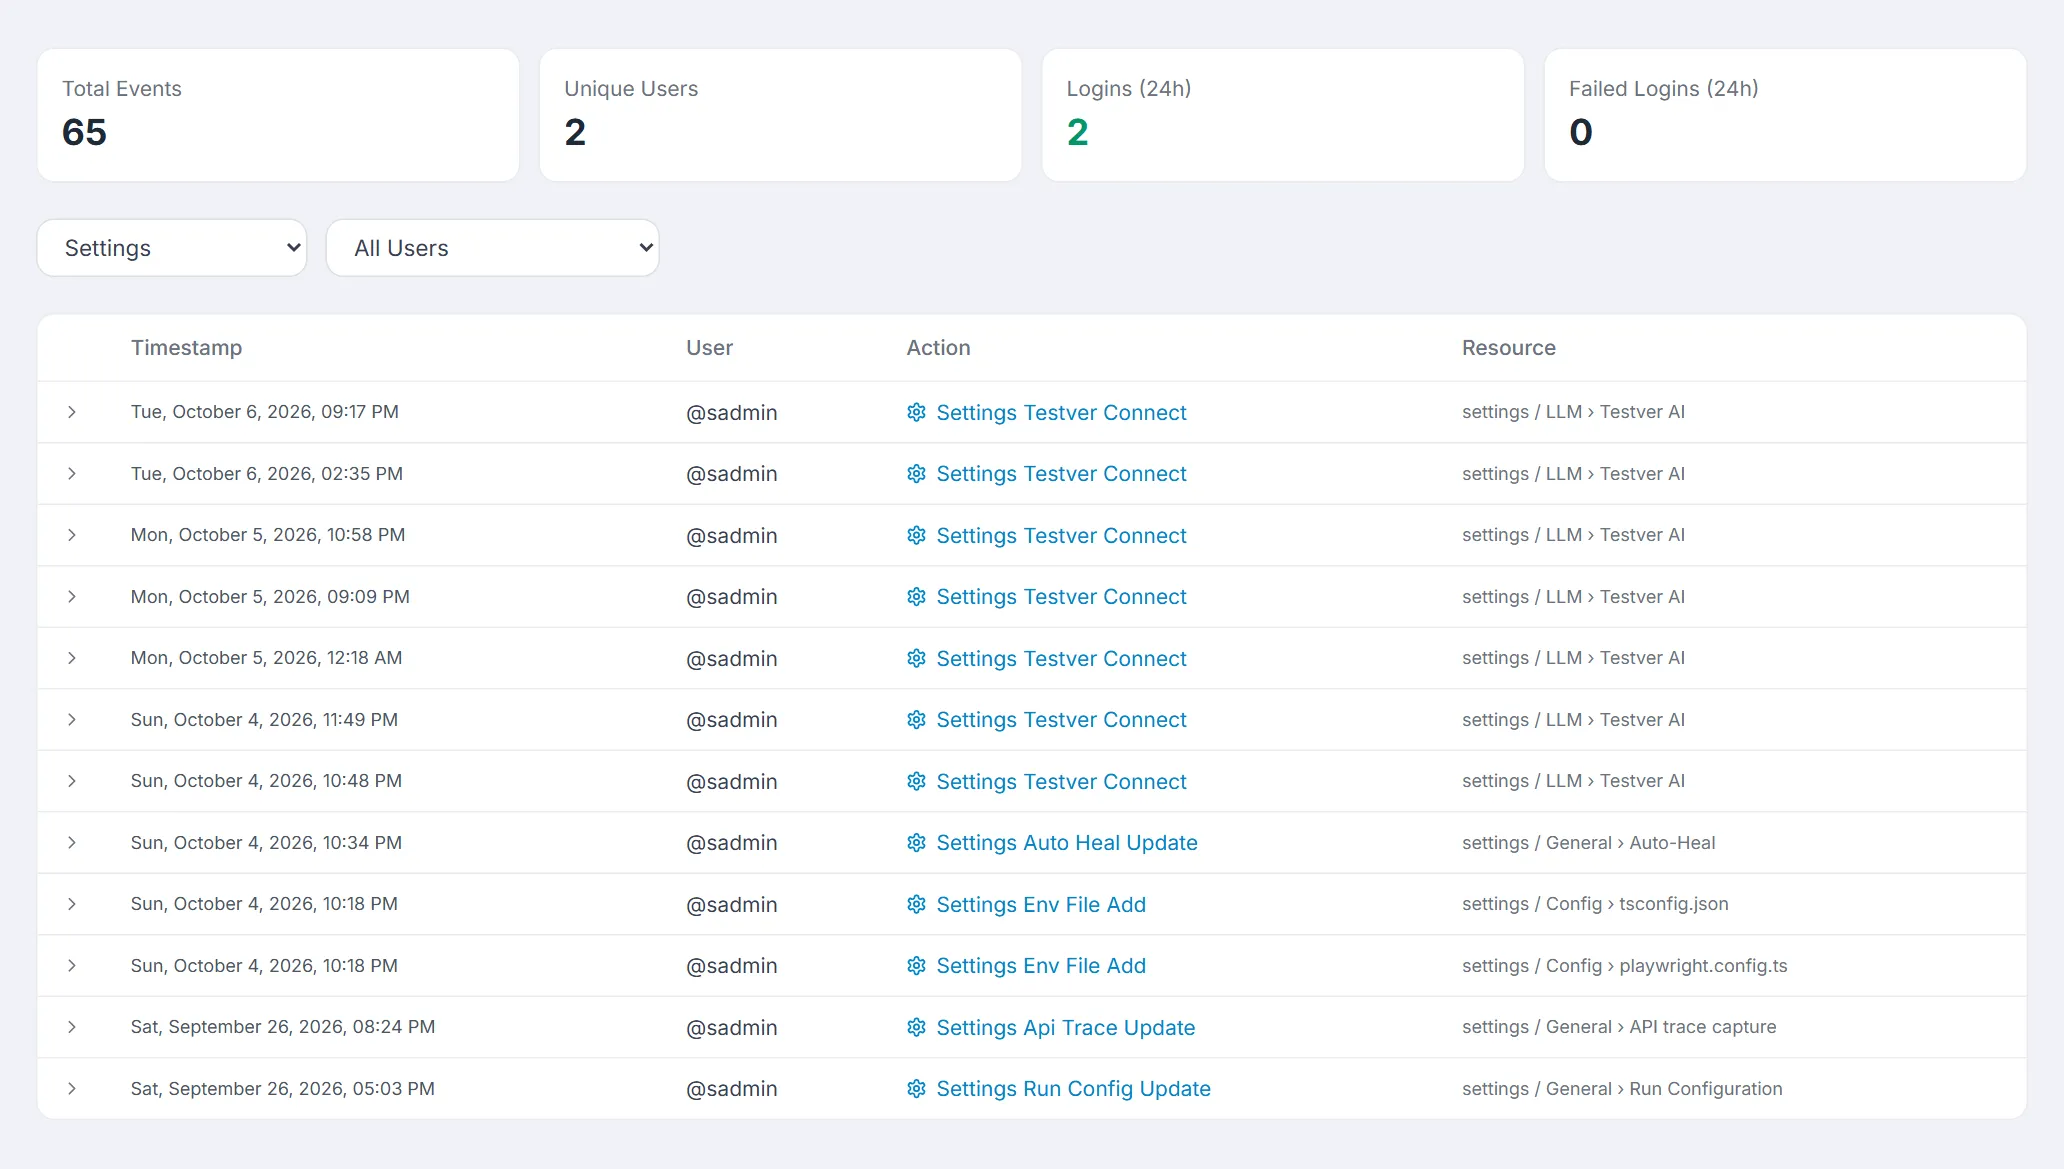
- Action filter — All Actions, or one category: Authentication, User Management, Test Runs, File Operations, Git Operations, AI Actions, or Settings.
- User filter — All Users, or one account (listed as Display Name (@username)) to see only what they did. Filters combine, so you can ask precise questions like “every settings change made by this user”. The count badge in the header follows the filters. Setting both back to All returns the full log. Changing a filter resets pagination back to page 1.
Events outside those categories — test management, defects, CI/CD, connectors, email and so on — appear only under All Actions.
What’s logged
Section titled “What’s logged”The Audit Log records action categories spanning the whole product. Recorded categories include:
| Category | Examples of recorded actions |
|---|---|
| Auth | Login, logout, password changed, session revoked. |
| User management | User created, role changed, account disabled / enabled / deleted. |
| Test management | Test case created / updated / deleted; plan and cycle operations; defect changes. |
| Run | Runs started, completed, and cancelled. |
| AI | AI Assistant tool calls, generations, and recordings made — the fact of the call only. |
| File / Git | File writes and deletes; Git screen actions — commits (with who each commit was made as), pushes (including publishing a new branch), pulls, fetches, branch create and switch, stash, discard, and conflict resolution (including deleting a file to resolve a delete/modify conflict). |
| Connector | Connector created / edited / deleted; test-connection performed. |
| Settings | Settings changes, listing each field’s before and after — sensitive values such as API keys are hidden. Browsers & Environments the AI Assistant saves to Run Configuration are recorded the same way, under the user who asked, marked via AI Assistant. |
| Test Data | Data Secret Reveal — a Tester or Admin showed the real values behind masked secrets in a Test Data preview. The entry names the file. |
What is NOT logged
Section titled “What is NOT logged”Some things are personal data and are deliberately kept out of the audit trail. They remain strictly user-scoped:
- Chat content — what users typed in the AI Assistant or Skills Chat.
- Recording content — what was captured in AI Record.
- Generated case content — the bodies of cases produced by AI Test Gen.
The log table
Section titled “The log table”The table’s columns, left to right:
- Details indicator — a chevron appears when the entry has expandable details.
- Timestamp — when it happened: Just now, 4m ago or 3h ago within the last day, then the full date and time.
- User — who performed it (@username, or @CI token “name” for CI/CD calls).
- Action — the action in readable form with an icon, e.g. Auth Login or Settings Auto Heal Update.
- Resource — what was affected, as type / id (e.g.
test-run / 5540f9404308c3cb,file / tests\pages\LoginPage.ts).
Per-row expansion
Section titled “Per-row expansion”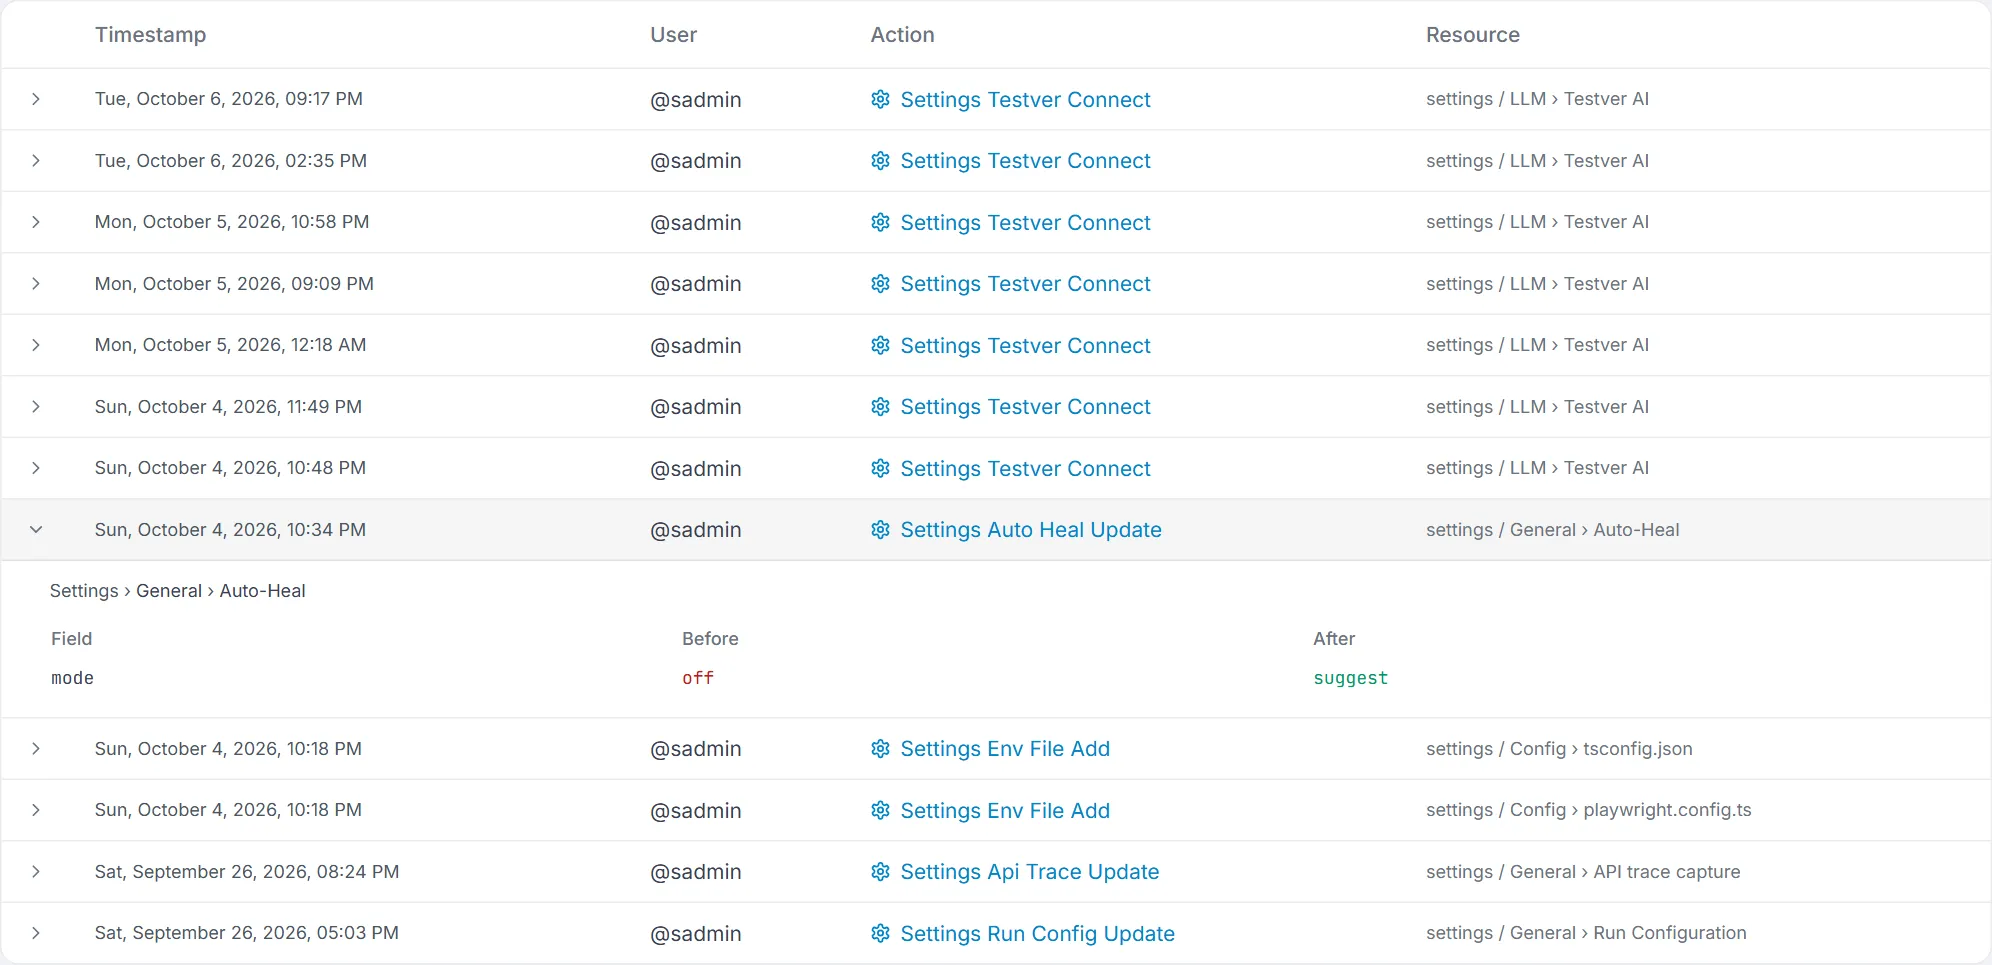
Click a row with a chevron to expand it. Settings entries show where the change was made (e.g. Settings › General › Auto-Heal) and a Field / Before / After table of the changed values. Other entries show their details payload inline as pretty-printed JSON — ideal for “what fields changed in this update?” investigations. For example, an update event might show the before/after of the changed fields:
{ "action": "defect.update", "user": "asha", "resource": "DEF-128", "details": { "status": { "from": "open", "to": "resolved" } }}Pagination
Section titled “Pagination”
Entries are paginated, 50 per page. When there is more than one page, a bar under the table shows Showing 1–50 of N with First, Previous, Page 1 of N, Next and Last. Remember that changing a filter resets you to page 1.
Export
Section titled “Export”The Export JSON button at the top downloads the full audit log (all entries, whatever filters are set) as a file named audit-log-YYYY-MM-DD.json. It is useful for:
- Offline review outside the app.
- Attaching to compliance or audit reports.
- Shipping into an external SIEM or log-analysis pipeline.
Common workflows
Section titled “Common workflows”The weekly five-minute review
Section titled “The weekly five-minute review”- Open the Audit Log.
- Set the action filter to Settings and review the changes.
- Set it to User Management and confirm each event was expected.
- Glance at Failed logins (24h) in the header stats.
Investigating “who deleted X?”
Section titled “Investigating “who deleted X?””- Leave the action filter on All Actions (test and plan deletions have no category of their own), or pick the category that fits — e.g. File Operations for a deleted file.
- Scan the Action and Resource columns for the item in question.
- Expand the row to read the details and confirm the user and timestamp.
Reconstructing one user’s activity
Section titled “Reconstructing one user’s activity”- Set the User filter to the person of interest.
- Page through their actions in chronological context.
- Expand rows where details matter to see exactly what changed.
Tips & best practices
Section titled “Tips & best practices”- Audit Log every Friday for five minutes. Filter to settings changes and user-management events and you’ll catch most issues early.
- Failed logins (24h) > 0 is the first thing to check after a suspected security event — even a small number can indicate exploration activity.
- Filter by user during incident response — it gives the fastest, cleanest reconstruction of one person’s actions.
- Export periodically so you keep a durable, off-platform record for compliance.
Troubleshooting
Section titled “Troubleshooting”| Symptom | Likely cause & fix |
|---|---|
| I can’t see the Audit Log | Your account is not an Admin. Use Profile ▸ Recent Activity for your own history, or ask an admin. |
| A row has no expand chevron | That entry simply has no extra details payload — the summary line is the whole record. |
| I can’t find the AI chat someone typed | By design. Chat, recording, and generated-case content are never logged — only the fact of the call. |
| Filters return nothing | The action/user combination has no matching events. Clear one filter to widen the search. |
| An API key looks blank in the details | Sensitive values are redacted on purpose; the log never stores secrets in clear text. |
| Failed logins are climbing | Investigate immediately — set the action filter to Authentication and the user filter to the affected account, and consider revoking sessions and resetting the password from the Users screen. |
Frequently asked questions
Section titled “Frequently asked questions”Can a Tester or Viewer see the Audit Log?
Section titled “Can a Tester or Viewer see the Audit Log?”No. It is admin-only. Non-admins can see their own actions under Profile ▸ Recent Activity.
Does the log store passwords or API keys?
Section titled “Does the log store passwords or API keys?”No. Auth events record that a password changed, not the password itself; settings events redact sensitive values such as API keys.
How far back does the log go?
Section titled “How far back does the log go?”It retains the full recorded history available to your instance. Export periodically if you need a durable archive beyond the in-app view.
Are automated actions logged too?
Section titled “Are automated actions logged too?”Calls that CI/CD Pipelines make with a CI token are logged under that token, e.g. @CI token “LocalRun” with Cicd Trigger.
Related
Section titled “Related”- Users — user actions to audit.
- Profile → Recent Activity — personal subset of this view.
- Settings — settings changes appear in this log.