AI Record
Introduction
Section titled “Introduction”What is AI Record?
Section titled “What is AI Record?”The AI Record screen lets you build a test by doing instead of coding. You start a live session — either a real Chromium browser (Web mode) or a cloud mobile device running your app (Mobile mode) — and simply interact with it: click links, fill forms, tap buttons, type text. Testver watches every interaction and records it as an ordered list of actions. When you are done, the AI reads your recorded actions together with your existing project, then writes a real test file that matches the framework, language, and conventions you already use.
Think of it like a dashcam for your app. You drive the route once — log in, search, add to cart, check out — and the recorder captures the whole journey frame by frame. Afterwards, instead of you writing down directions from memory, an assistant watches the footage and writes a clean, repeatable route description that anyone (or any CI pipeline) can follow again.
Who this guide is for
Section titled “Who this guide is for”This guide is written for the person sitting in front of the screen who wants a test without writing it line by line. You do not need to know Playwright, WebdriverIO, or Appium to use it.
- QA engineers and testers who want to capture a flow quickly and hand the heavy lifting to AI.
- Developers who want a starting-point test that already matches the project’s page objects and helpers.
- Product and support staff who can reproduce a bug or flow by clicking through it, and want that turned into a regression test.
- Anyone validating that a flow still works — you can replay your recorded steps before generating code.
Key terms
Section titled “Key terms”| Term | What it means here |
|---|---|
| Recording | A single capture session — from the moment you click Start Recording until you click stop. It holds the ordered list of actions, a duration, and (after generation) the AI conversation. Recordings are saved to Recording History. |
| Action | One captured interaction — a click, a fill, a hover, a key press, a navigate, etc. Each action becomes a numbered step in the timeline with an icon, a description, and (for clicks) a screenshot thumbnail. |
| Assertion | A check you add on purpose — e.g. ‘this element is visible’ or ‘this text equals X’. You enter Assert mode, click the element you want to verify, and the recorder adds an assert step instead of clicking it. |
| Locator | How a step finds its element again later (a CSS selector, accessibility role, text, etc.). Each recorded action carries a selector; you can refresh it with Re-inspect Element if the page changed. |
| Codegen | Code generation — the step where AI (or, on mobile, a static template) converts your recorded actions into an actual test file in your project, written to match your existing style. |
| Session reuse | Keeping the same live browser/device session alive so a later run can attach to it instead of cold-starting. If a browser is already running when you start, the recorder reuses that session rather than launching a fresh one. |
How it works
Section titled “How it works”- You open the screen and pick a mode — Web (a browser) or Mobile (a cloud device + app).
- You start the session. In Web mode a Chromium browser launches (or your already-open one is reused); in Mobile mode a cloud Appium session boots on the device and app you chose.
- You interact with the live view. Each click, type, tap, or key press is captured and streamed into the action timeline on the left, complete with thumbnails.
- Optionally you add assertions (checks), annotations (notes), edit step descriptions, re-order steps by dragging, or delete steps.
- You stop the recording. The captured steps remain editable, and you can Playback them to confirm they replay correctly.
- You choose a target (a brand-new test, or merge into an existing test), pick an AI model, and click Generate. The AI first analyzes your project and proposes a plan; you confirm, and it writes the code, runs the test, and fixes failures.
- The finished recording — steps plus the full AI conversation and any file diffs — is saved to Recording History so you can reopen it later.
Getting Started
Section titled “Getting Started”Opening AI Record
Section titled “Opening AI Record”- From the left navigation, open AI Record (the route is
/ai-record). - The screen opens in the mode that matches your workspace. A web-only workspace lands on the Web recorder; a mobile-only workspace lands on the Mobile recorder.
- If your workspace supports both kinds (or the kind is unknown), a small Web | Mobile toggle appears in the header so you can switch.
- If you have an unfinished recording from before, an Unsaved Draft Found banner appears at the top with Resume Draft and a discard (trash) button.
The screen layout
Section titled “The screen layout”The screen is split: the recorder (timeline, controls, generation panel) sits on the left, and the live view (browser or device) sits on the right once a session is active. A draggable divider lets you resize the split between 25% and 75%.
| Area | Where | What it does |
|---|---|---|
| Header bar | Top of the recorder | Shows the current phase (Browser Recorder / Recording with a live red dot + timer + action count / Recording Stopped / Generating Code… / Code Generated) and the relevant action buttons. |
| History button | Far left of the header | Toggles the Recording History sidebar. |
| Action timeline | Left, main area | The numbered list of captured steps with icons, descriptions, and screenshot thumbnails. Also where AI text, tool calls, and file diffs appear during generation. |
| Live view | Right side | The live browser canvas (Web) or live device mirror (Mobile). Resizable, and in Web mode can pop out as a floating Picture-in-Picture window. |
| Generation panel | Bottom (when stopped) | Test name / target-test picker, model selector, Playback, and Generate Test Code (or Merge & Generate). |
| Follow-up bar | Bottom (when generating/done) | A chat box to confirm the AI’s plan or request changes to the generated code. |
At a glance
Section titled “At a glance”- Two modes share one screen: Web (browser, red accent) and Mobile (device, indigo accent).
- Every interaction in the live view becomes a numbered, editable step.
- Assert mode adds checks; Annotate mode adds notes; Pause lets you click around without recording.
- Playback replays your steps so you can verify them before generating.
- Generation is AI-driven, runs an analyze-then-confirm flow, and saves the full transcript to history.
- Recordings can be renamed, tagged, searched, and reopened from Recording History.
Choosing a Mode
Section titled “Choosing a Mode”Web vs Mobile
Section titled “Web vs Mobile”Pick the mode that matches what you are testing. If a Web | Mobile toggle is shown in the header, click it to switch. Web records interactions in a Chromium browser; Mobile records taps and input on a cloud device running your installed app build.
Setting up a Web session
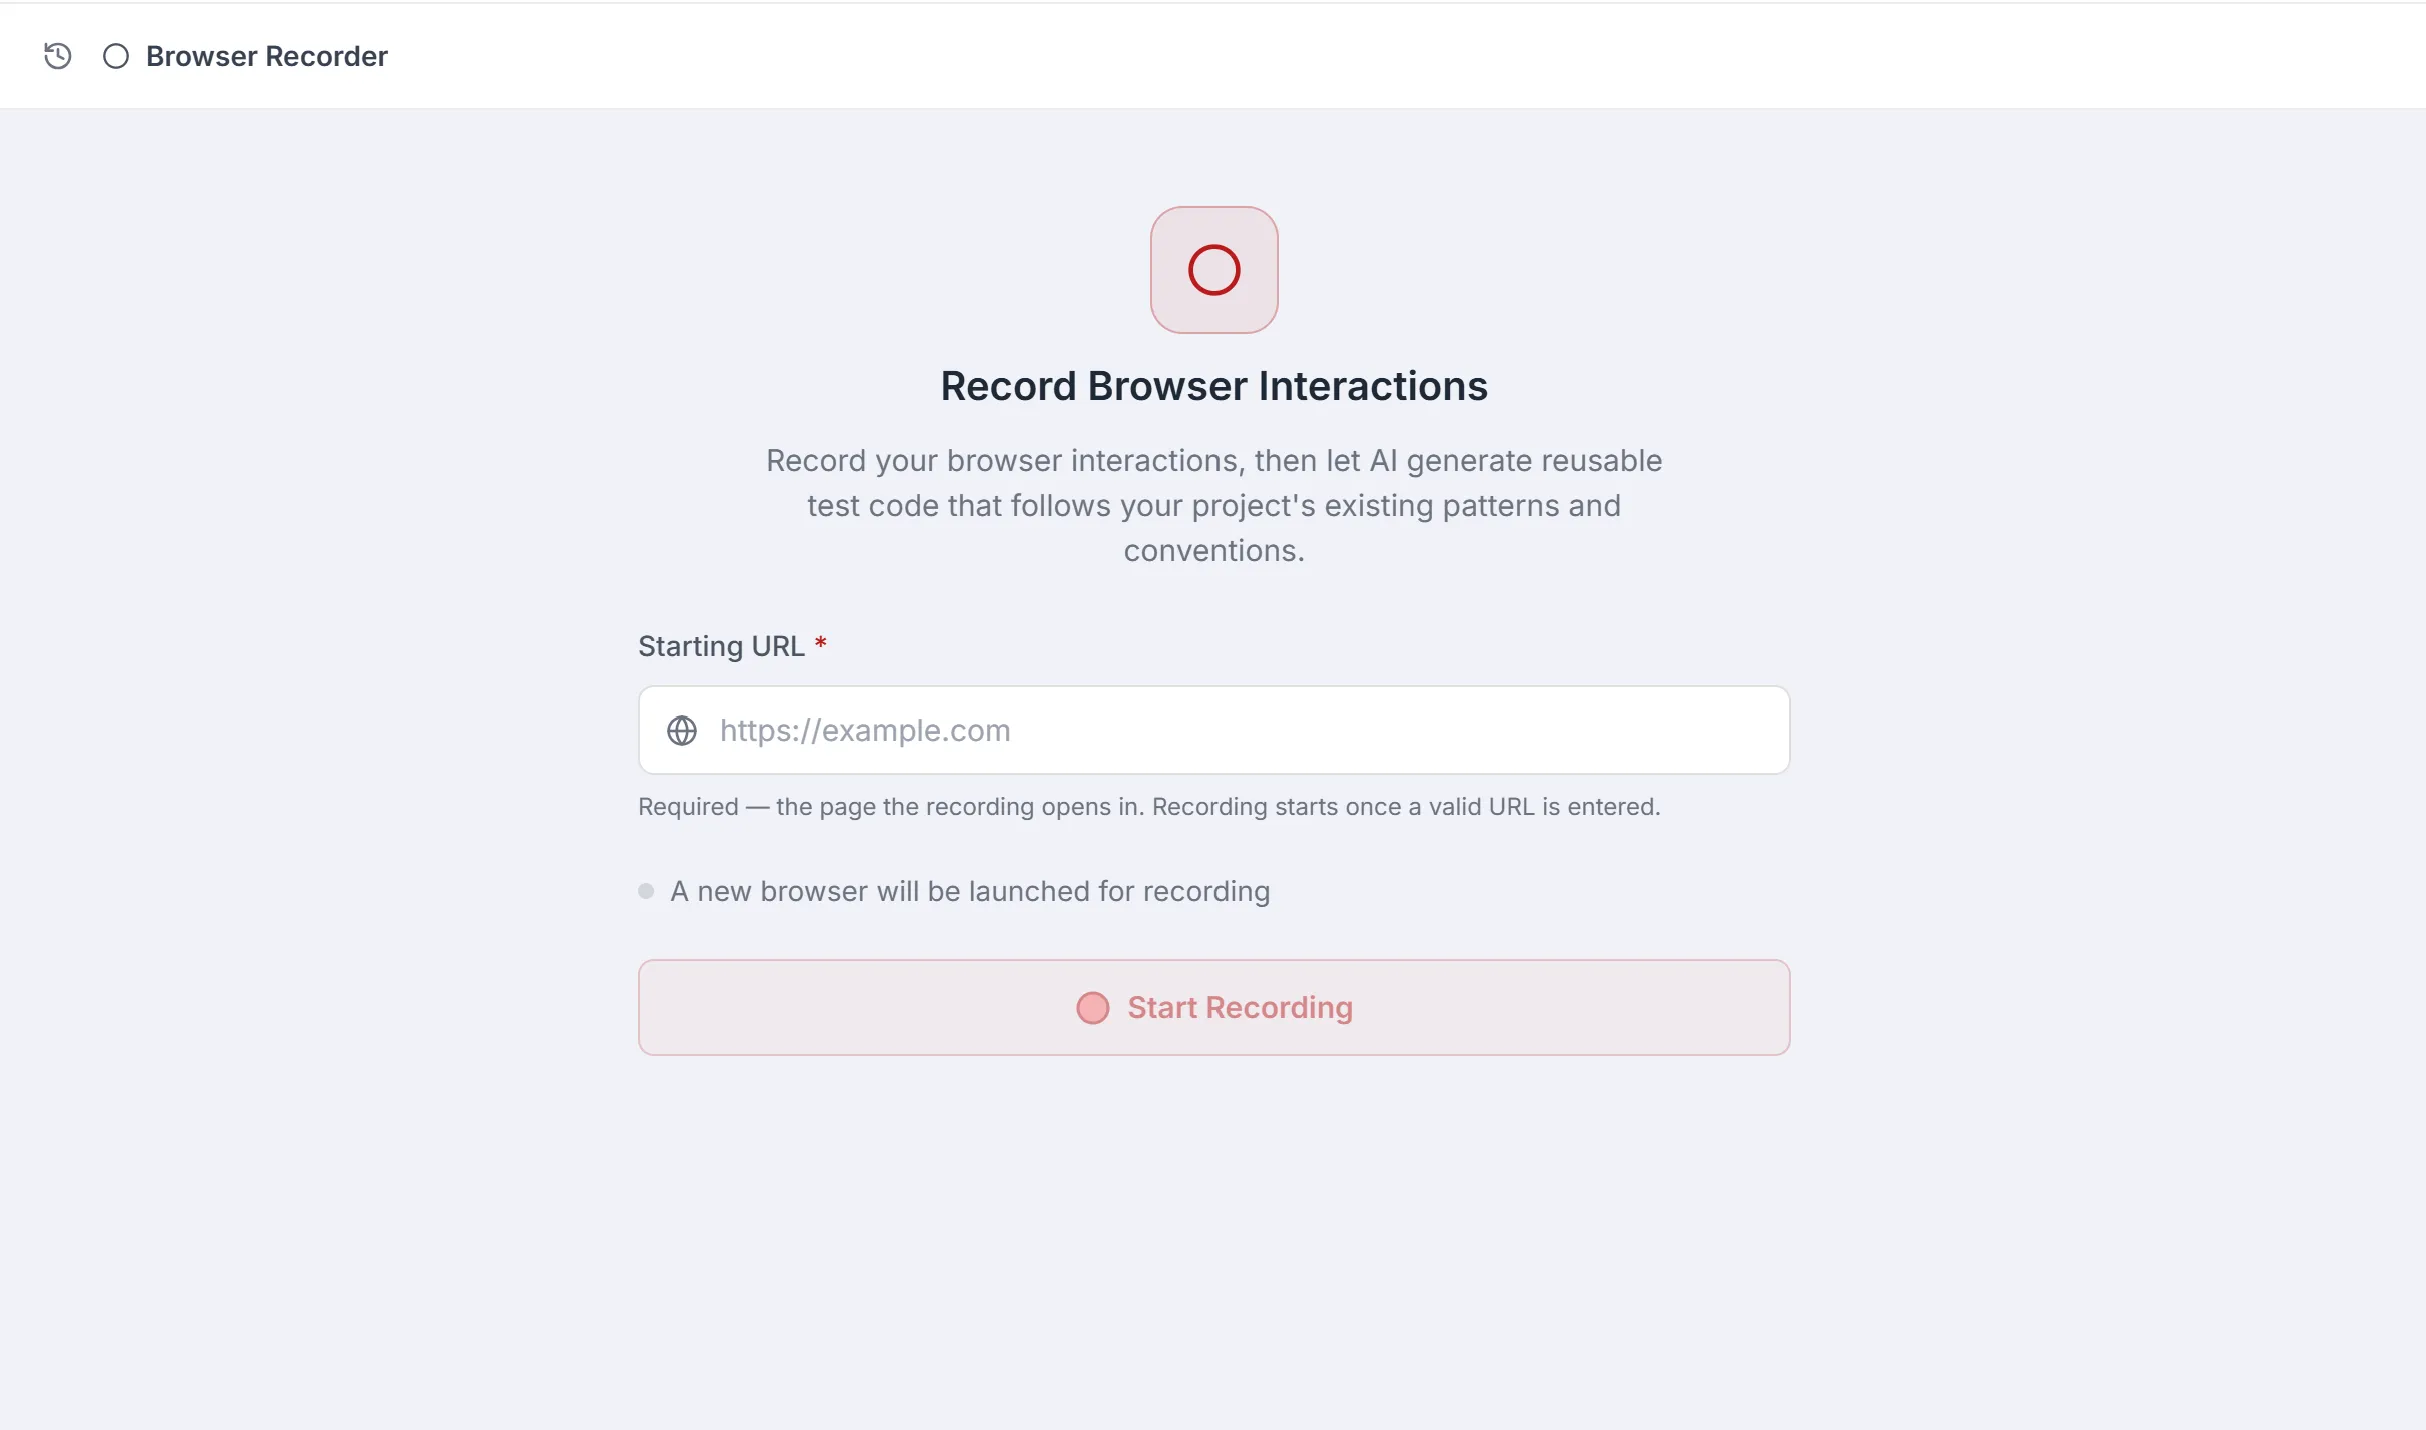
Section titled “Setting up a Web session”- On the setup screen you’ll see the heading Record Browser Interactions and a single field, Starting URL (optional).
- Type a URL (for example
https://example.com) if you want the browser to open there first. You can leave it blank and navigate yourself. - Check the browser status line: a green dot means a browser is already running and the recording will reuse that session; a grey dot means a new browser will be launched.
- Click Start Recording (or press Enter in the URL field). A Chromium window opens and the live view appears on the right.
Setting up a Mobile session
Section titled “Setting up a Mobile session”- On the setup screen (Record Mobile App Interactions) choose a Provider (e.g. BrowserStack, or a local device provider). A warning appears if that provider has no credentials — add them under Connectors first.
- Pick a Device from the searchable list. Real devices are sorted to the top; the list defaults to a sensible choice (an iPhone or Pixel where available).
- Pick an App, or click Upload to add a new
.apkor.ipabuild. Upload shows a progress bar. - Check the session status line: a green dot means an existing session will be reused; grey means a new session will be launched.
- Click Start Recording. Booting a fresh cloud session can take 30–60 seconds on first launch. Once ready, the device mirror appears on the right.
The live session view
Section titled “The live session view”Once recording, the right-hand panel streams the live session. In Web mode this is an interactive browser canvas; in Mobile mode it is a mirror of the device screen. You interact with it directly, and every interaction is captured.
- Web — tabs & URL bar: switch tabs, type a URL to navigate, and use back / forward / reload buttons.
- Web — control mode: toggle between AI and User control. In User mode your clicks, typing, scrolling, and double-clicks are forwarded to the page (and recorded).
- Web — viewport presets: switch the page size between Mobile (375×812), Tablet (768×1024), Desktop (1280×720), and Full HD (1920×1080).
- Web — element highlight: the crosshair toggle highlights the element under your cursor with its tag, id, and class.
- Web — DevTools panel: a toggle opens a resizable Network/Console panel below the canvas.
- Web — Picture-in-Picture: pop the live view into a floating, draggable, resizable window (with maximize).
- Web — status bar: shows Live/Offline, current FPS, and viewport dimensions; you can Disconnect / Connect the stream or Close the browser session.
- Mobile — device mirror: click directly on the mirrored screen to record taps; use the composer below the timeline to type text or send hardware keys.
Recording Your Test
Section titled “Recording Your Test”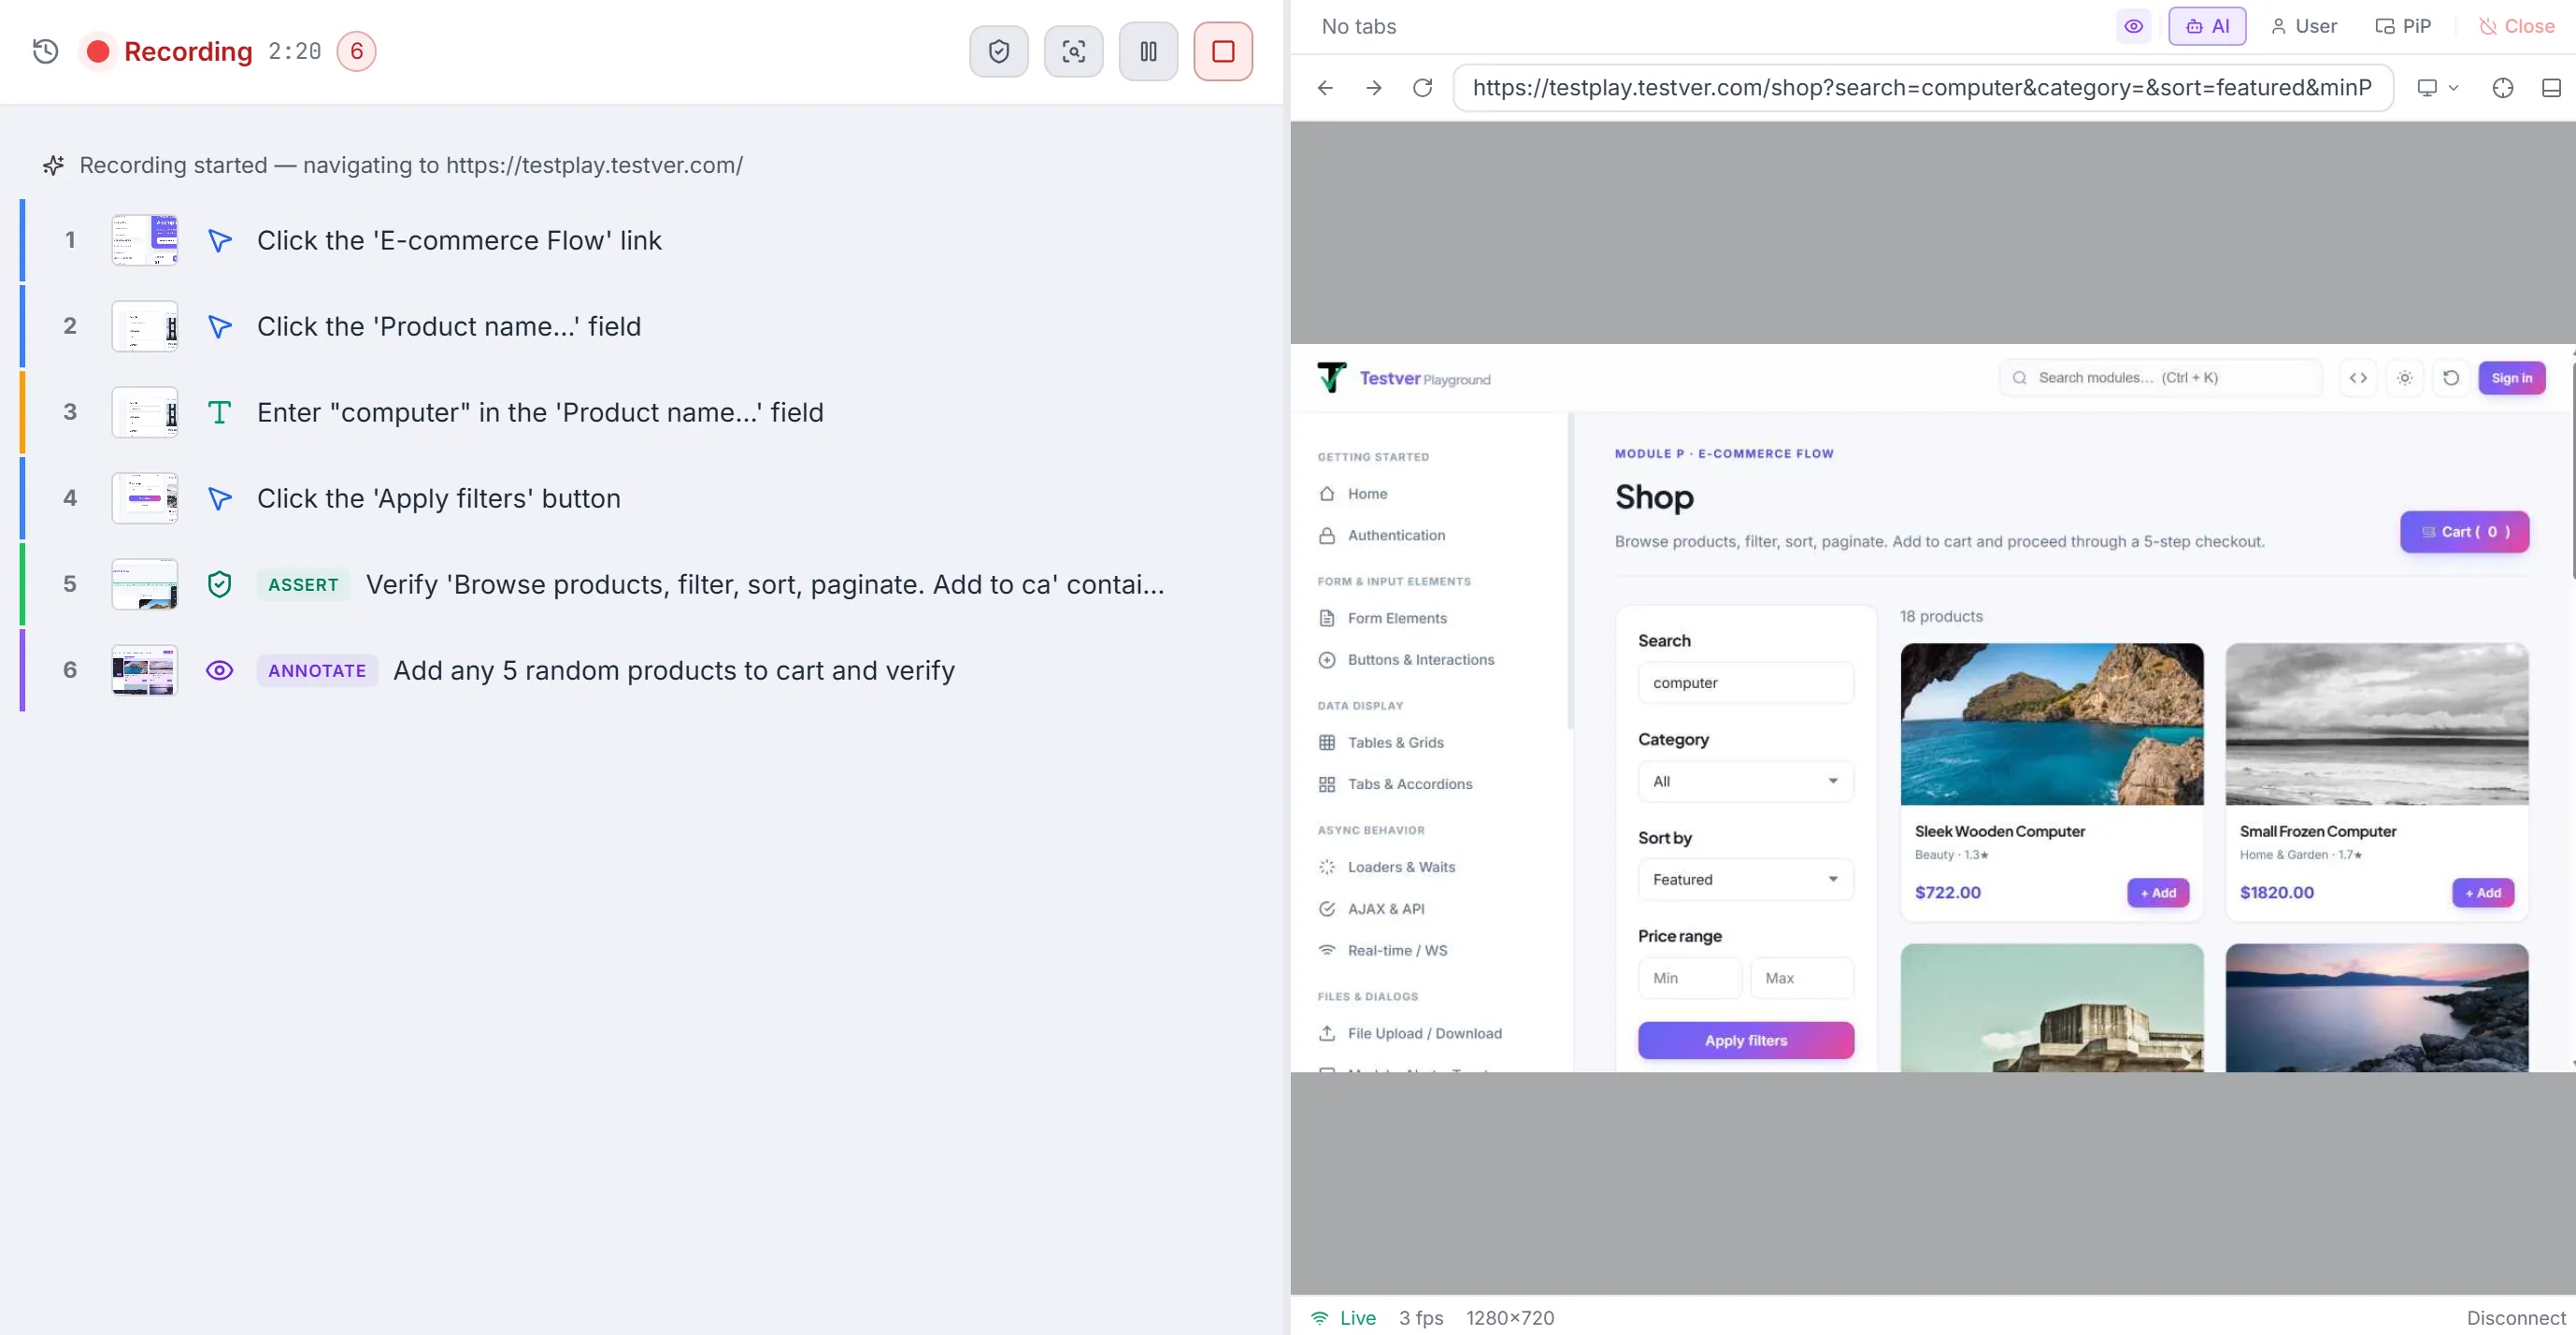
The step timeline
Section titled “The step timeline”As you interact, steps appear in the timeline — each numbered, with an action icon, a plain-English description, and (for clicks) a screenshot thumbnail you can click to enlarge. The header keeps a running action count and an elapsed timer.
| Action type | Triggered by | Example description |
|---|---|---|
| click / dblclick | Clicking / double-clicking an element | Click ‘Sign in’ button |
| fill / type | Typing into a text field | Enter ‘user@test.com’ into Email |
| press | Pressing a key (e.g. Enter, Tab) | Press Enter |
| navigate | Loading a new URL | Navigate to https://example.com |
| select | Choosing from a dropdown | Select ‘United States’ |
| check / uncheck | Toggling a checkbox | Check ‘Remember me’ |
| hover | Hovering over an element | Hover over Account menu |
| assert | Assert mode — clicking an element to verify it | Assert ‘Welcome’ is visible |
| annotate | Annotate mode — attaching a note | Note: cart should show 2 items |
Adding assertions
Section titled “Adding assertions”- While recording (and not paused), click the shield (Assert) button in the header. It turns green and shows ON.
- Click the element in the live view you want to verify. Instead of clicking it for real, the recorder captures an
assertstep (e.g. visibility or text check). - Assert mode automatically turns off once the assertion is captured. You can press ESC in the browser to exit it manually.
- Assert and Annotate are mutually exclusive — turning one on turns the other off.
Annotating steps
Section titled “Annotating steps”- Click the scan (Annotate) button in the header; it turns purple and shows ON.
- On Web, annotate captures intent about an element. On Mobile, a note input appears below the timeline — type a short note describing the intent of the next step and send it.
- The note is stored as an
annotatestep (purple accent) and gives the AI extra context when it generates the test.
Editing steps
Section titled “Editing steps”- Open a step’s menu: hover a step and click the ⋮ menu. Options are Re-inspect Element and Remove.
- Re-inspect Element: re-picks the element on the live page to refresh its locator and description — useful if the page changed or the original selector is fragile. (Not available on
annotatesteps.) - Remove: deletes the step from the timeline and from the backend so playback and generation use the updated list.
- Reorder (drag & drop): when the recording is stopped, drag any step up or down. A blue line shows exactly where it will land, and the dropped step briefly glows so you can find it.
- Edit description (Mobile): tap a step to rename its description inline, then save.
- Add more steps: after stopping, click Add More Steps to resume the same recording and capture additional interactions.
- Screenshots: click a step’s thumbnail to open a full-size preview with the target element highlighted.
Generating the Test
Section titled “Generating the Test”Choosing where the test goes
Section titled “Choosing where the test goes”Stop the recording to reveal the generation panel at the bottom. First choose where the test should go:
- New Test — creates a brand-new test file. A Test Name field is required (e.g.
login-flow-test). On Web it may be pre-filled from the site’s hostname. - Add to Existing Test — merges your recorded steps into a test you already have. Pick the Target Test from the hierarchical suite → test picker (the same project-wide test list used elsewhere in Testver).
When merging, choose an Insert Position: Guide AI (the default — the AI decides placement based on your guidance) or Append At End. With Guide AI you must fill the Guide AI box; type
@there to reference the target test’s existing steps (and, on Mobile, your recorded steps too) so you can write instructions like ‘insert after @[Given I am on the homepage]’.
Framework and language detection
Section titled “Framework and language detection”The generated test matches your project automatically — the AI infers the framework and language from your existing tests, dependencies, and conventions rather than asking you to pick. You do choose which AI model writes it.
| Option | Where | Behaviour |
|---|---|---|
| AI model / provider | Model selector in the bottom bar | Pick from your configured providers and models (only providers with an API key or a local model appear). Defaults to your configured default provider/model. |
| Framework & language | Inferred automatically | The AI reads your project (sample tests, package.json, etc.) and writes code in the same framework, language, and style. There is no manual framework dropdown in the AI flow. |
| Mobile formatter (static) | Mobile only | The Mobile recorder also defaults to a wdio-appium-ts style formatter for its template path; the primary AI path still infers language from your project. |
| Healing manifest | Mobile, automatic | Mobile generation also writes a healing manifest so brittle locators can self-recover on later runs. |
Generating the code
Section titled “Generating the code”- Click Generate Test Code (new test) or Merge & Generate (existing test). The button is disabled until the required fields are filled (test name, or target test + guidance).
- The header switches to Generating Code… and the AI first runs an analyze-only pass: it reads your project and recorded actions and explains its plan in the timeline. No files are written yet.
- When the plan is ready the header changes to Waiting for your input and the bottom chat bar prompts you to review.
- Press Enter (empty) to approve and proceed, or type feedback to adjust the approach before the AI writes code.
- The AI then writes the test, runs it, and fixes failures — streaming its text, tool calls, and file diffs inline in the timeline.
- If the AI requests a sensitive action, a permission card appears above the chat bar with Allow, Always allow, or Deny. Respond to continue.
- You can click the Stop button at any time to abort the current generation.
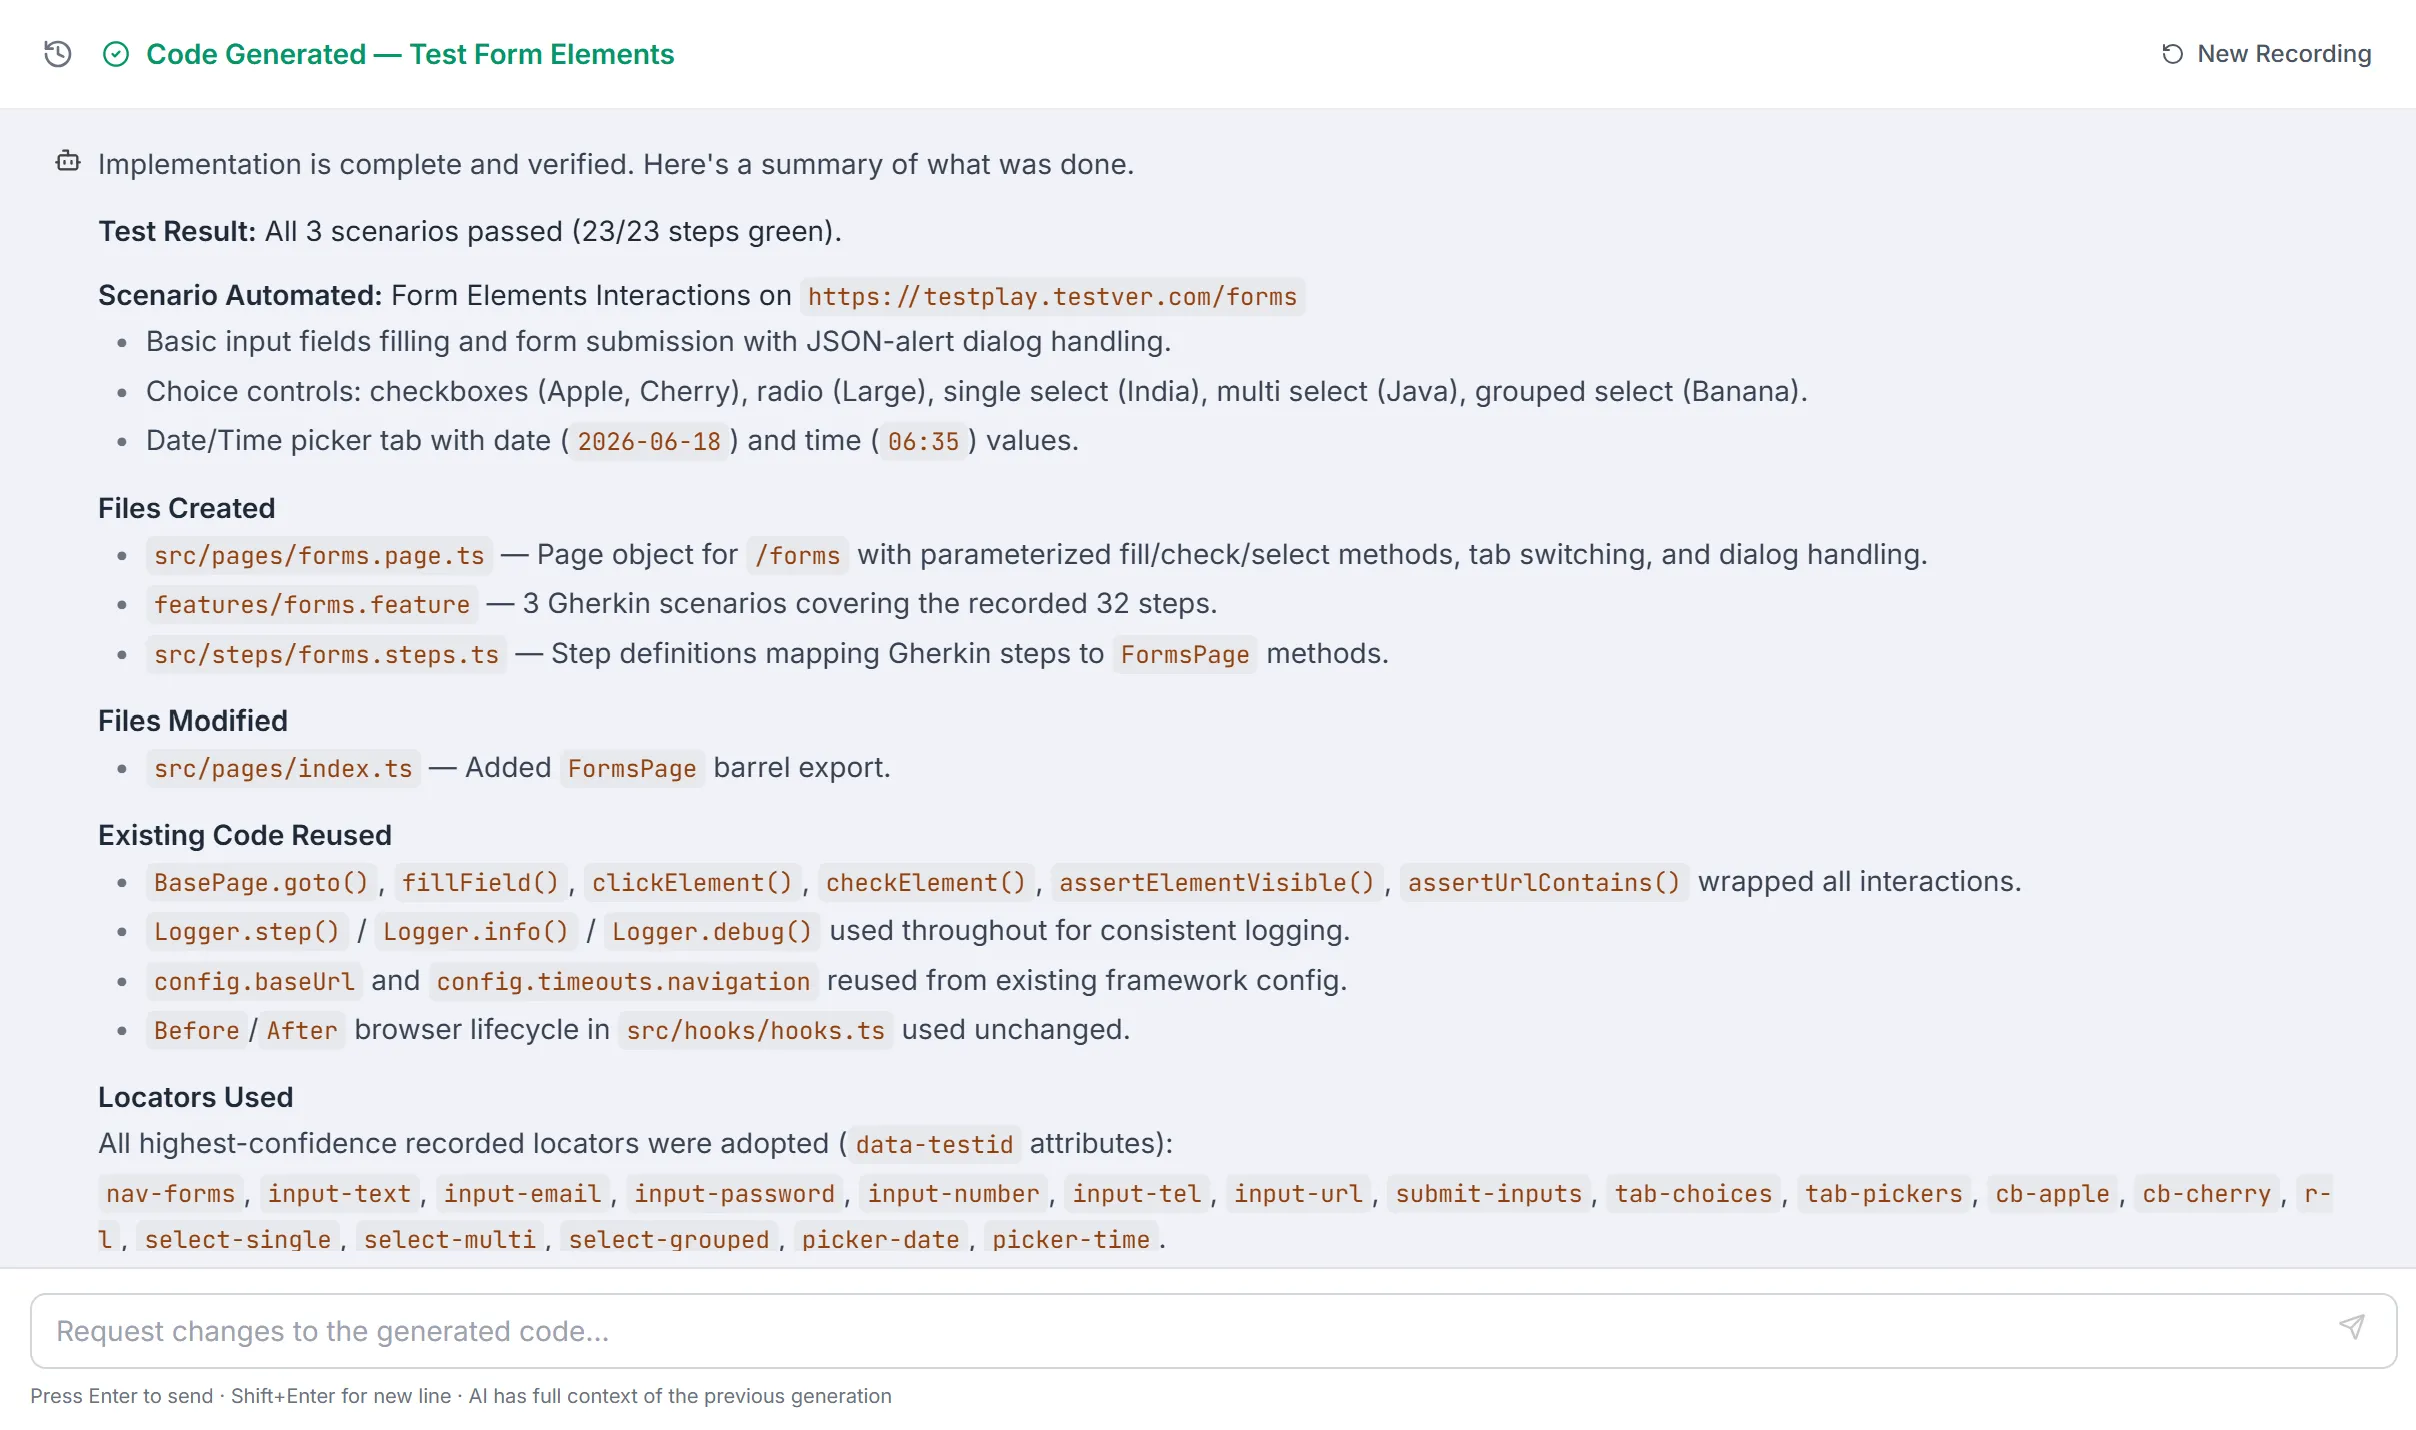
Reviewing the result
Section titled “Reviewing the result”- When generation finishes the header shows Code Generated — <test name> (or Generation Failed / Stopped). The new or modified test file is written into your project and shows up in the file diffs.
- The whole recording — steps, AI conversation, tool calls, and diffs — is saved to Recording History automatically, tagged with its outcome.
- Because the test is now a real file in your project, it appears in the Test Explorer and can be run from the Runner like any other test.
- Follow-up edits: use the bottom chat bar after generation to request changes (‘rename the test’, ‘add a check for the total’). The AI keeps full context of the previous generation. Reusing the session in the Runner: the live session you recorded in (the browser, or the cloud device) stays running. If you go to run the new test right after generating, the run can attach to that still-open session instead of cold-starting a new one — which is why a green status dot at setup reads ‘recording will reuse it’. The window for that reuse is short (roughly a couple of minutes of session life), so run the generated test promptly if you want to ride the same warm session.
Recording History
Section titled “Recording History”Click the History (clock) button in the header to slide open the Recording History sidebar. It lists your past recordings — drafts are hidden — grouped by Today, Yesterday, This Week, and Earlier.
- Status / outcome badge: each row shows an icon — Generated (green check), Failed (red), Stopped (grey square), Recorded, or Draft.
- Open a recording: click a row to reload it. Completed runs reopen in the done state with the full timeline and code; un-generated ones reopen in the stopped state where you can edit and generate.
- Search: filter recordings by name or URL.
- Tags: add labels (presets include
login,checkout,search,smoke,regression,e2e,navigation,form, plus your own custom tags) and filter the list by tag. - Rename: double-click a name, or use the ⋮ → Rename.
- Delete: ⋮ → Delete (with a confirmation dialog) permanently removes the recorded actions, generated-code history, and conversation.
Common Tasks (How Do I…?)
Section titled “Common Tasks (How Do I…?)”| I want to… | Do this |
|---|---|
| Record a web flow | Pick Web, optionally enter a URL, click Start Recording, interact with the browser. |
| Record a mobile flow | Pick Mobile, choose provider + device + app, click Start Recording, tap on the device mirror. |
| Add a verification/check | Click Assert (shield), then click the element to verify. |
| Leave a note for the AI | Click Annotate, then add your note. |
| Click around without recording | Click Pause; click Resume when ready to record again. |
| Continue a stopped recording | Click Add More Steps. |
| Re-check that steps work | Stop, then click Playback (Mobile asks whether to restart the app first). |
| Remove or fix a step | Hover the step → ⋮ → Remove or Re-inspect Element. |
| Re-order steps | After stopping, drag steps up/down in the timeline. |
| Make a brand-new test | Stop → New Test → fill Test Name → Generate Test Code. |
| Add steps to an existing test | Stop → Add to Existing Test → pick the target test → guide the AI → Merge & Generate. |
| Change which AI model is used | Open the model selector in the bottom bar and pick a provider/model. |
| Tweak the generated code | Type a request in the bottom chat bar after generation. |
| Find or reopen a past recording | Open History, search or filter by tag, click the row. |
| Free the live session | Click Close in the Web live view, or end the mobile session. |
Tips & Best Practices
Section titled “Tips & Best Practices”- Start from a clean state. Enter a starting URL (Web) or rely on a fresh app launch (Mobile) so the recording always begins from a known point.
- Add assertions where it matters. A flow that only clicks doesn’t prove anything — drop an
asserton the key outcome (a success message, a cart total) so the generated test actually verifies behaviour. - Annotate tricky steps. A short note about why a step exists gives the AI better context and produces clearer code.
- Use Pause to set up. Navigate, log in, or dismiss popups while paused so only the meaningful steps are captured.
- Playback before you generate. Replaying confirms your steps are solid and saves a wasted generation cycle.
- Review the analysis plan. When the header says Waiting for your input, read the AI’s plan before approving — it’s cheaper to redirect now than to fix code later.
- Tag and name recordings. Meaningful names plus tags like
smokeorcheckoutmake History easy to navigate as it grows. - Run the new test promptly if you want to reuse the warm live session — it doesn’t stay open indefinitely.
Troubleshooting & FAQ
Section titled “Troubleshooting & FAQ”| Symptom / Question | Answer |
|---|---|
| My clicks aren’t being recorded (Web) | Make sure the live view is in User control mode (not AI), and that recording isn’t Paused — a paused header shows an amber ‘Paused’ label. |
| The browser closed and recording stopped | An external close is detected and the recording is stopped automatically with a ‘Browser closed — recording stopped’ note. Start a new recording to continue. |
| Mobile session is taking forever to start | First-time cloud sessions can take 30–60 seconds. The header shows Starting session…. If it errors, check provider credentials under Connectors. |
| The provider says ‘(no credentials)‘ | Add that provider’s credentials in Connectors before selecting it; the device list stays empty until then. |
| The Generate button is greyed out | You need at least one action plus the required fields: a Test Name for a new test, or a Target Test (and guidance, in Guide AI mode) for a merge. |
| Generation says it failed | Open the timeline to see the error or fail marker, then use the follow-up chat to ask the AI to fix it, or click New Recording and try again. Note a single failed tool call alone is not a failure. |
| A permission card appeared | The AI wants to run a sensitive action. Click Allow (once), Always allow (for the rest of the session), or Deny. |
| I lost my recording on reload | Look for the Unsaved Draft Found banner — drafts auto-save every 10 seconds. Click Resume Draft. |
| Where did my generated test go? | Into your project as a real file (shown in the file diffs). It also appears in the Test Explorer and can be run from the Runner. |
| Can I edit steps after stopping? | Yes — until you generate, you can re-order (drag), delete, re-inspect, and (on Mobile) rename step descriptions. |
| The selector for a step looks fragile | Open the step’s ⋮ menu and choose Re-inspect Element to re-pick it and refresh the locator. |
| How do I switch between Web and Mobile? | Use the Web | Mobile toggle in the header — it appears when your workspace supports both kinds. |
Related
Section titled “Related”- AI Assistant — refine generated tests in chat.
- Test Explorer — run the saved test.
- Local Browser Connector — record on your own machine.
- Settings → Browser Sessions — see and close active recording browsers.