

Test Plans & Cycles
Introduction
Section titled “Introduction”What is the Test Plans screen?
Section titled “What is the Test Plans screen?”The Test Plans screen is where you organize the test cases you have already written into deliberate, named collections and then run them. A plan answers the question “which tests belong to this release or feature?”; a cycle answers “which round of running those tests is this?”; and a run (execution) is the act of actually checking one test case and marking the result.
Think of it like a school exam. The plan is the syllabus — the fixed list of topics that will be tested. A cycle is one sitting of the exam — “Midterm,” “Re-sit,” “Final” — each covering the same syllabus but on a different date with its own score sheet. An execution (run) is grading one single question on that sheet: pass, fail, blocked, or skipped.
It is important to keep the three levels straight because they nest:
- Plan -> contains a set of test cases (added from your catalog) plus zero or more cycles.
- Cycle -> contains one execution per test case in the plan, captured at the moment the cycle was created.
- Execution -> contains one status (pass/fail/blocked/skipped/etc.), plus optional step-by-step results, evidence files, and a linked defect.
Who this guide is for
Section titled “Who this guide is for”- Test leads / QA managers who build a plan for a release or sprint, decide which test cases go in, and create cycles for each test round.
- Manual testers who open a cycle, walk through each test case step by step, and record what passed and what failed.
- Automation engineers whose mapped scripts can be launched directly from a cycle, individually or all at once.
- Anyone tracking progress — leads and stakeholders who watch the progress bars, pass rate, and completion percentage to know how a test round is going. No coding is required to use any part of this screen. Running automated scripts simply triggers tests that engineers mapped elsewhere; the buttons here just start them and collect the results.
Key terms
Section titled “Key terms”| Term | What it means on this screen |
|---|---|
| Test Plan | A named collection of test cases, optionally tagged with a Release, Sprint, and Status (Draft / Active / Completed / Archived). |
| Test Cycle | One execution round over a plan. Has its own name, optional assignee, start date and end date. Creating a cycle generates one execution per test case in the plan. |
| Execution | The result record for one test case within one cycle. Carries a status, optional duration, who ran it, step results, evidence, and a possible linked defect. |
| Status (execution) | One of Not Run, In Progress, Passed, Failed, Blocked, or Skipped. |
| Status (plan/cycle) | One of Draft, Active, Completed, or Archived. |
| Step Result | The pass/fail/blocked/skipped outcome of a single step inside a test case, recorded on the manual step-execution screen. |
| Pass Rate | Passed executions divided by total executions, as a percentage. |
| Completion | Executions that are no longer Not Run, divided by total, as a percentage. |
| Evidence | Files (screenshots, logs, exports) attached to a single execution as proof of what happened during the run. |
| Defect | A bug record created from a failed or blocked execution, capturing the failed step details. |
| Re-run Failed | Creates a brand-new cycle containing only the failed test cases from an existing cycle, so you can retest just the failures. |
| Mapped script | An automation script that an engineer has linked to a test case; cycles show a bot icon for these and let you run them. |
How it relates to Test Cases & Results
Section titled “How it relates to Test Cases & Results”Test Plans sits downstream of the Test Cases catalog and upstream of execution history:
- Test Cases are authored elsewhere (the Test Management / Test Cases screen). Test Plans only references them — adding a case to a plan does not copy or modify the case, and removing it from a plan never deletes it from the catalog.
- When you build the Add Test Cases dialog you can filter by the same attributes as the Test Cases screen (priority, type, status, automation, tags, source) so the same mental model carries over.
- Executing a cycle produces the results and history for those cases — pass rates, durations, evidence, and linked defects — which feed the analytics shown on this screen and the wider reporting elsewhere in Testver.
Getting Started
Section titled “Getting Started”Opening Test Plans
Section titled “Opening Test Plans”- From the left navigation, open Test Plans (route
/test-plans). - The screen opens on the Plans List — the default view, showing every plan as a card in a grid.
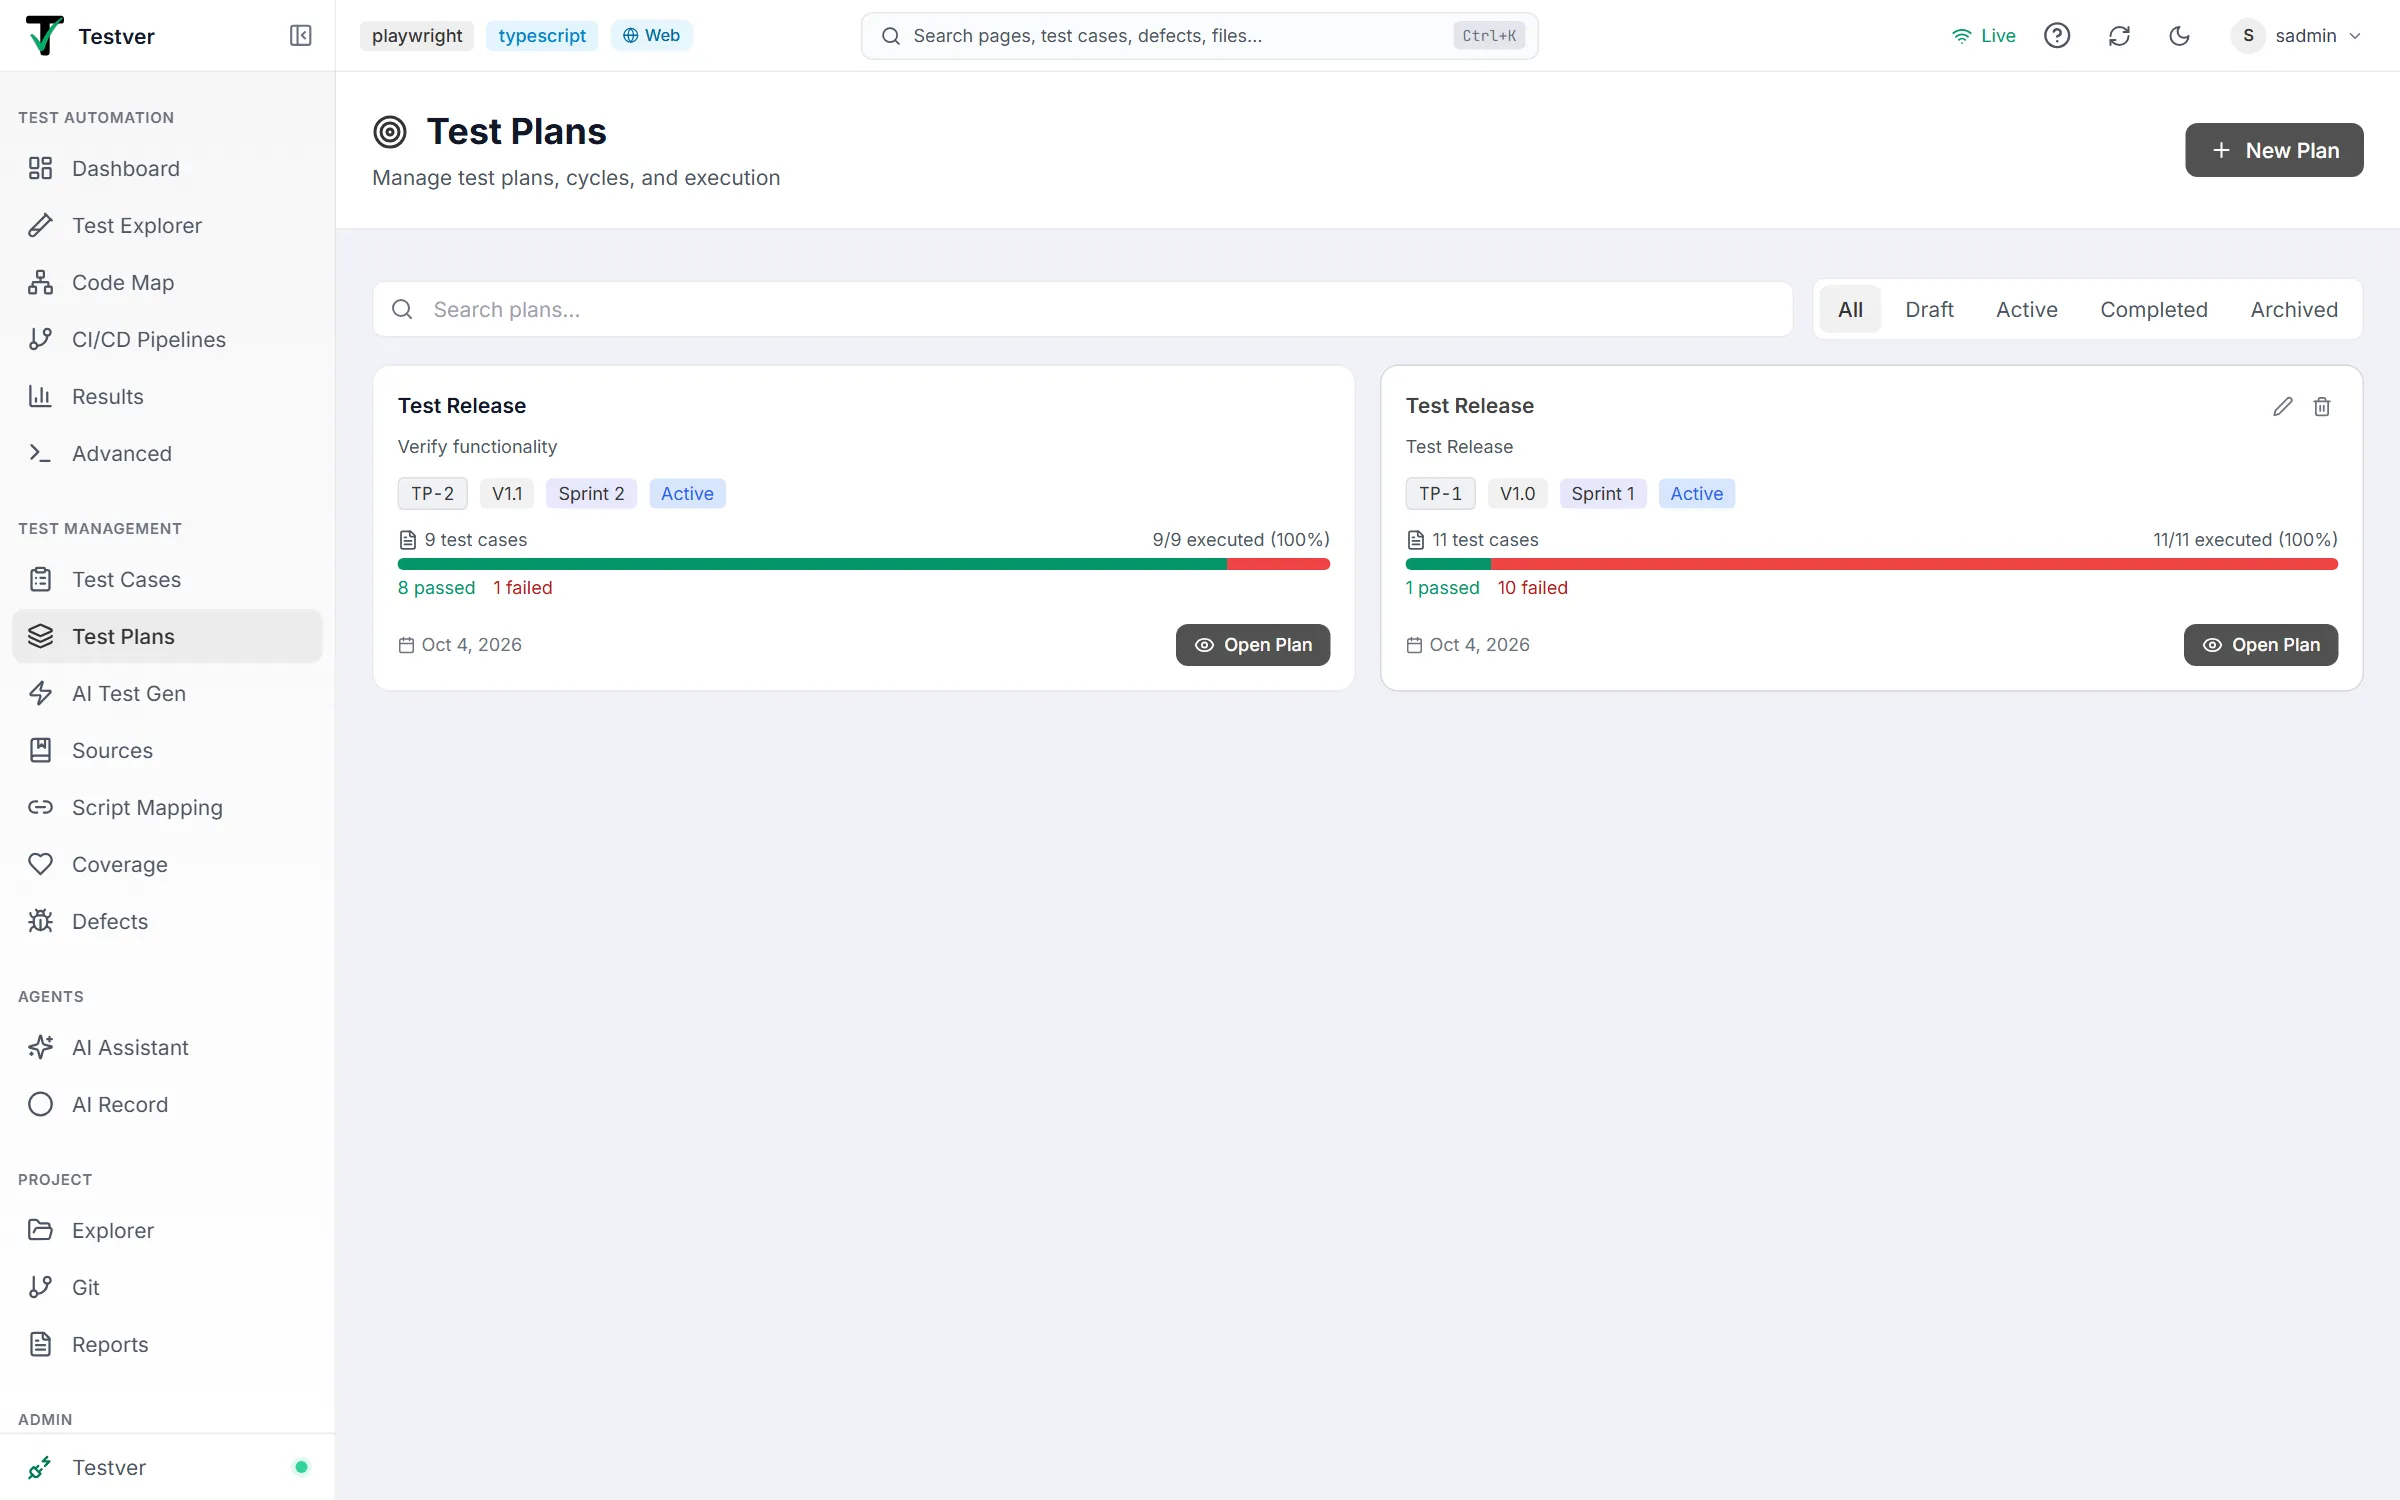
- If you have no plans yet, you see an empty state with a Create Plan button. Otherwise, the most recent plans appear as cards. The screen has four nested views. You move into them by clicking and back out using the breadcrumb trail at the top of each inner view:
| View | How you reach it | What it shows |
|---|---|---|
| Plans List | Default landing view | All plans as cards, with search and a status filter. |
| Plan Detail | Click Open Plan on a card | One plan’s info, plus two tabs: Test Cases and Cycles. |
| Cycle Execution | Click Execute on a cycle | The execution list for one cycle: per-case status, stats, analytics, automation, JIRA publish. |
| Step Execution | Click Steps on an execution row | The step-by-step run sheet for one test case, plus evidence and defect actions. |
The screen layout
Section titled “The screen layout”| Area | Location | Purpose |
|---|---|---|
| Title bar | Top | Target icon, the heading Test Plans, the subtitle “Manage test plans, cycles, and execution,” and a New Plan button on the right. |
| Search box | Below title bar, left | Free-text Search plans… — filters cards by plan name or description as you type. |
| Status filter | Below title bar, right | Pill buttons: All, Draft, Active, Completed, Archived. |
| Plans grid | Main area | Plan cards, two per row on wide screens, one per row on narrow screens. |
| Plan card | Within grid | Name, description, ID/Release/Sprint/Status badges, test-case count, a colored progress bar, pass/fail/remaining counts, created date, and Open Plan. |
At a glance
Section titled “At a glance”- Every plan card is self-summarizing: a single progress bar shows green (passed), red (failed), and amber (executed-but-other) segments at a glance.
- The search box and status filter combine — searching narrows whatever the status filter currently shows.
- All destructive or long-running actions (delete a plan/cycle, remove a test case, run automation) pop a themed confirmation dialog before anything happens.
- Create/Edit dialogs open as centered modal overlays; clicking the dark backdrop or the X closes them without saving.
The Plans List
Section titled “The Plans List”The Plans List is the home of the screen. Each plan is a card; the cards are arranged in a responsive grid.
Reading a plan card
Section titled “Reading a plan card”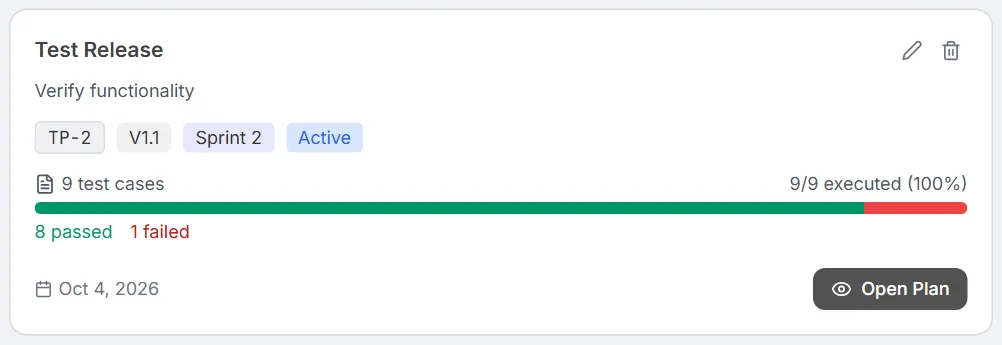
| Element | Meaning |
|---|---|
| Plan name | The title; hovering reveals the full name if truncated. Clicking it opens the plan. |
| Description | Up to two lines of the plan’s description (clamped), shown only if one exists. |
| ID badge | The plan’s identifier, in monospace — useful for referencing the plan elsewhere. |
| Release badge | The release tag (blue), shown only if set, e.g. v2.5. |
| Sprint badge | The sprint tag (indigo), shown only if set, e.g. Sprint 14. |
| Status badge | Draft (gray), Active (blue), Completed (green), or Archived (slate). |
| Test-case count | ”N test cases” with a document icon. |
| Executed count | ”executed / total (percent%)” — how far the plan has been run across its cycles. |
| Progress bar | Green = passed, red = failed, amber = executed-but-neither, on a gray track. |
| Counts line | Shown once anything is executed: green “N passed,” red “N failed,” gray “N remaining.” |
| Created date | When the plan was created, with a calendar icon. |
| Open Plan button | Opens the Plan Detail view. |
Searching & filtering plans
Section titled “Searching & filtering plans”
- Type in the Search plans… box to filter cards by name or description (case-insensitive, matches partial text).
- Click a status pill — All, Draft, Active, Completed, or Archived — to show only plans in that status.
- Combine both: the search filters within whatever the status pill currently shows.
Editing & deleting a plan
Section titled “Editing & deleting a plan”Hover over a card to reveal the Edit (pencil) and Delete (trash) icons in the top-right corner. They stay hidden until hover to keep the cards clean.
| Action | How | Result |
|---|---|---|
| Open | Click the name or Open Plan | Goes to Plan Detail. |
| Edit | Hover, click the pencil | Opens the Edit Plan modal pre-filled with the plan’s values. |
| Delete | Hover, click the trash | Opens a confirmation dialog; on confirm the plan and all its cycles and execution history are permanently removed. |
| Create new | Click New Plan in the title bar | Opens the empty New Test Plan modal. |
Creating & Editing a Plan
Section titled “Creating & Editing a Plan”Opening the plan form
Section titled “Opening the plan form”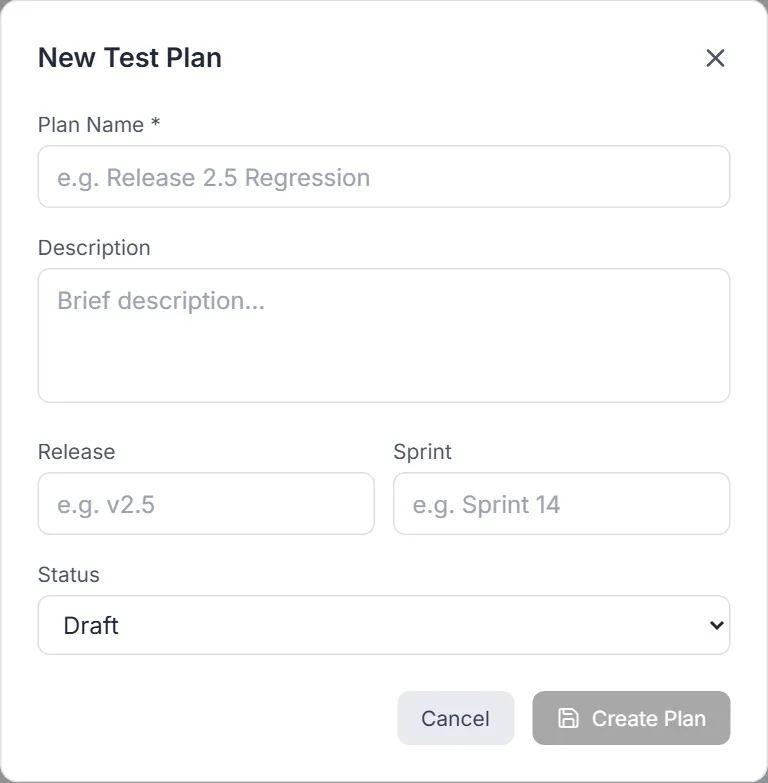
- Click New Plan (title bar) to create, or the pencil icon on a card / Edit in Plan Detail to edit an existing plan.
- A centered modal appears titled New Test Plan or Edit Plan.
- Fill in the fields below, then click Create Plan / Update Plan.
- Click Cancel, the X, or the dark backdrop to close without saving.
Plan fields
Section titled “Plan fields”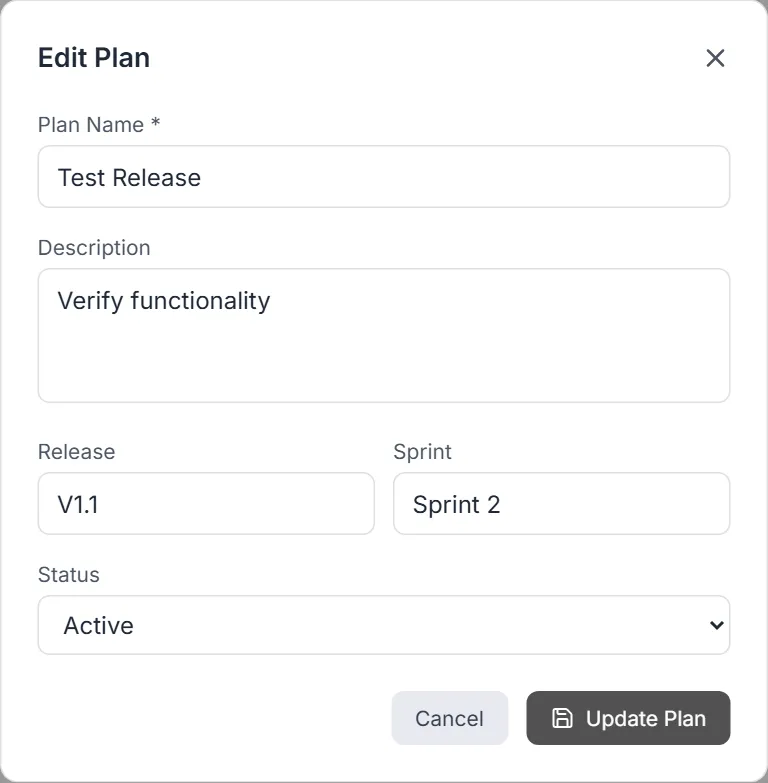
| Field | Required | Notes |
|---|---|---|
| Plan Name | Yes | The plan’s title, e.g. “Release 2.5 Regression.” The Create/Update button stays disabled until this is filled. |
| Description | No | Free-text summary, up to a few lines. Placeholder: “Brief description…” |
| Release | No | Short release tag, e.g. v2.5. Shown as a blue badge on cards. |
| Sprint | No | Short sprint tag, e.g. Sprint 14. Shown as an indigo badge on cards. |
| Status | No (defaults to Draft) | Dropdown: Draft, Active, Completed, Archived. |
Adding test cases to the plan
Section titled “Adding test cases to the plan”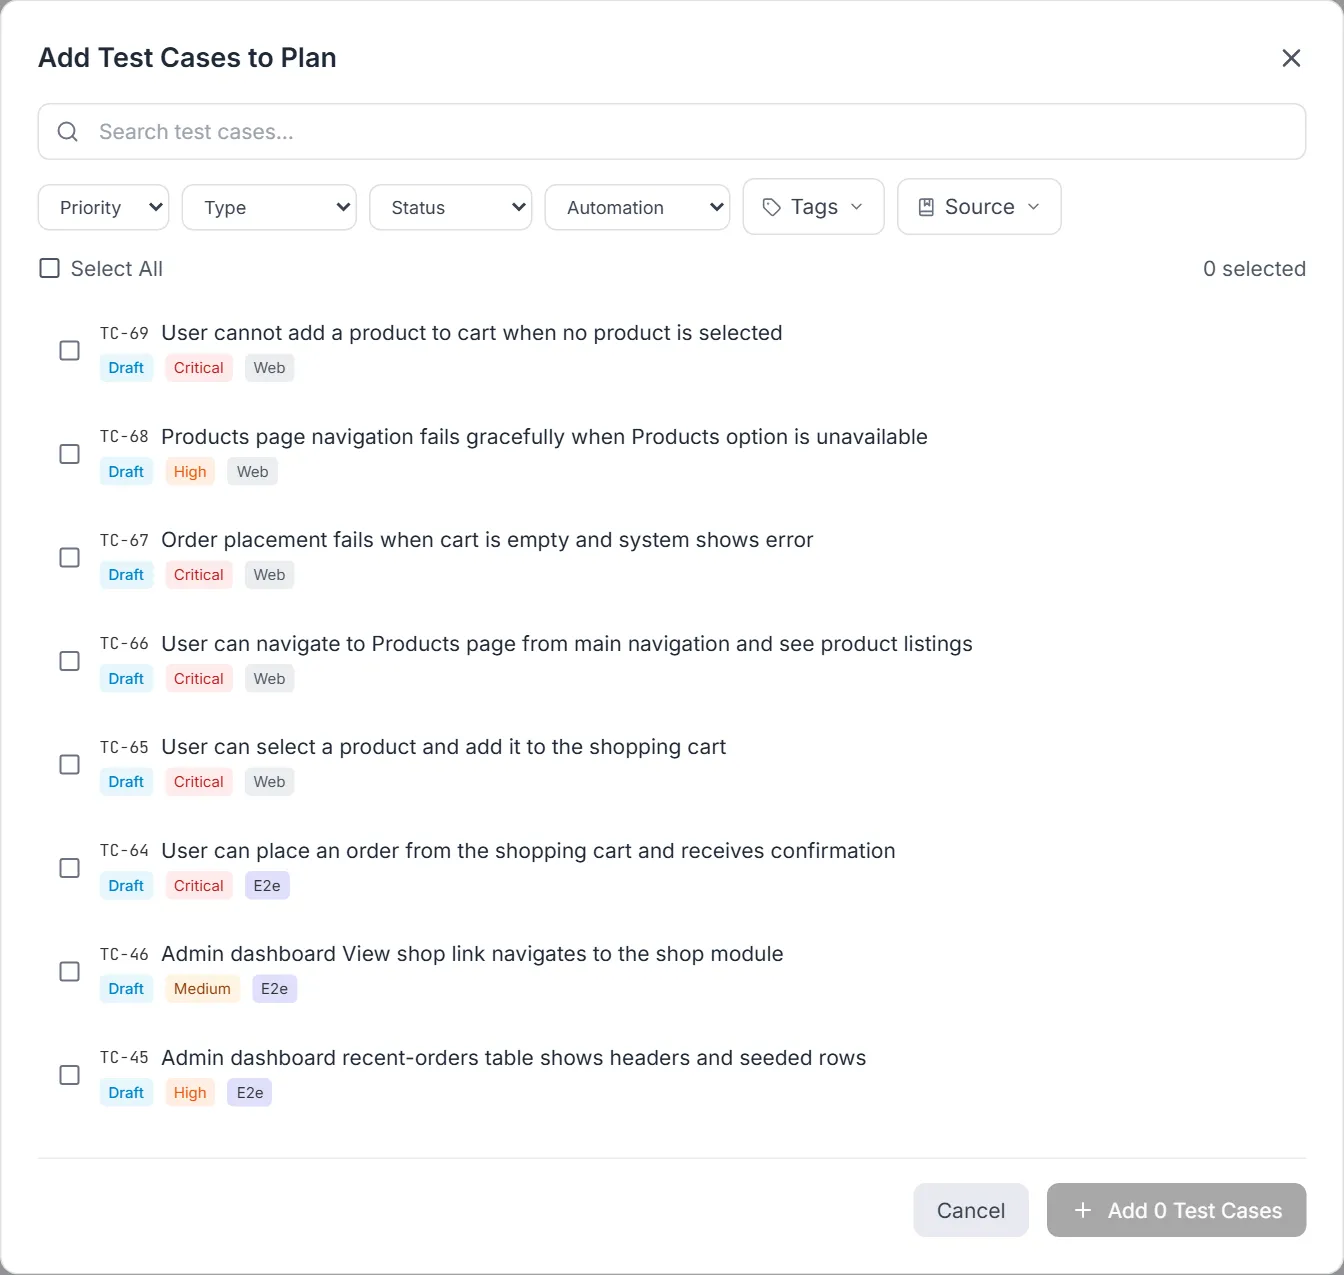
A new plan starts empty. You add test cases from the Test Cases tab of Plan Detail.
- Open the plan, stay on (or switch to) the Test Cases tab.
- Click Add Test Cases. A large picker dialog opens titled Add Test Cases to Plan.
- Use the Search test cases… box and the filter row to narrow the list.
- Click a row to toggle its checkbox, or use Select All to toggle every currently-listed case.
- Click Add N Test Cases to add the selected cases to the plan.
- Cases already in the plan are automatically excluded from the picker so you cannot add duplicates. The picker’s filter row mirrors the Test Cases screen so the same controls behave the same way:
| Filter | Options |
|---|---|
| Priority | Critical, High, Medium, Low |
| Type | Web, UI, API, Mobile, Database, Integration, E2E, Security, Performance, Usability, Accessibility, Compatibility, Localization |
| Status | Draft, Active, Deprecated, Archived |
| Automation | Manual, Automated, Needs Update |
| Tags | Multi-select of your defined tags |
| Source | Single-select of a source that has test cases |
Each row in the picker shows the test case’s ID (monospace) and title, then small badges for its status, priority, and type — plus its folder when the case is filed in one. A counter at the top-right shows how many are selected; a Clear (N) link appears when any attribute filters are active.
The Test Cases tab
Section titled “The Test Cases tab”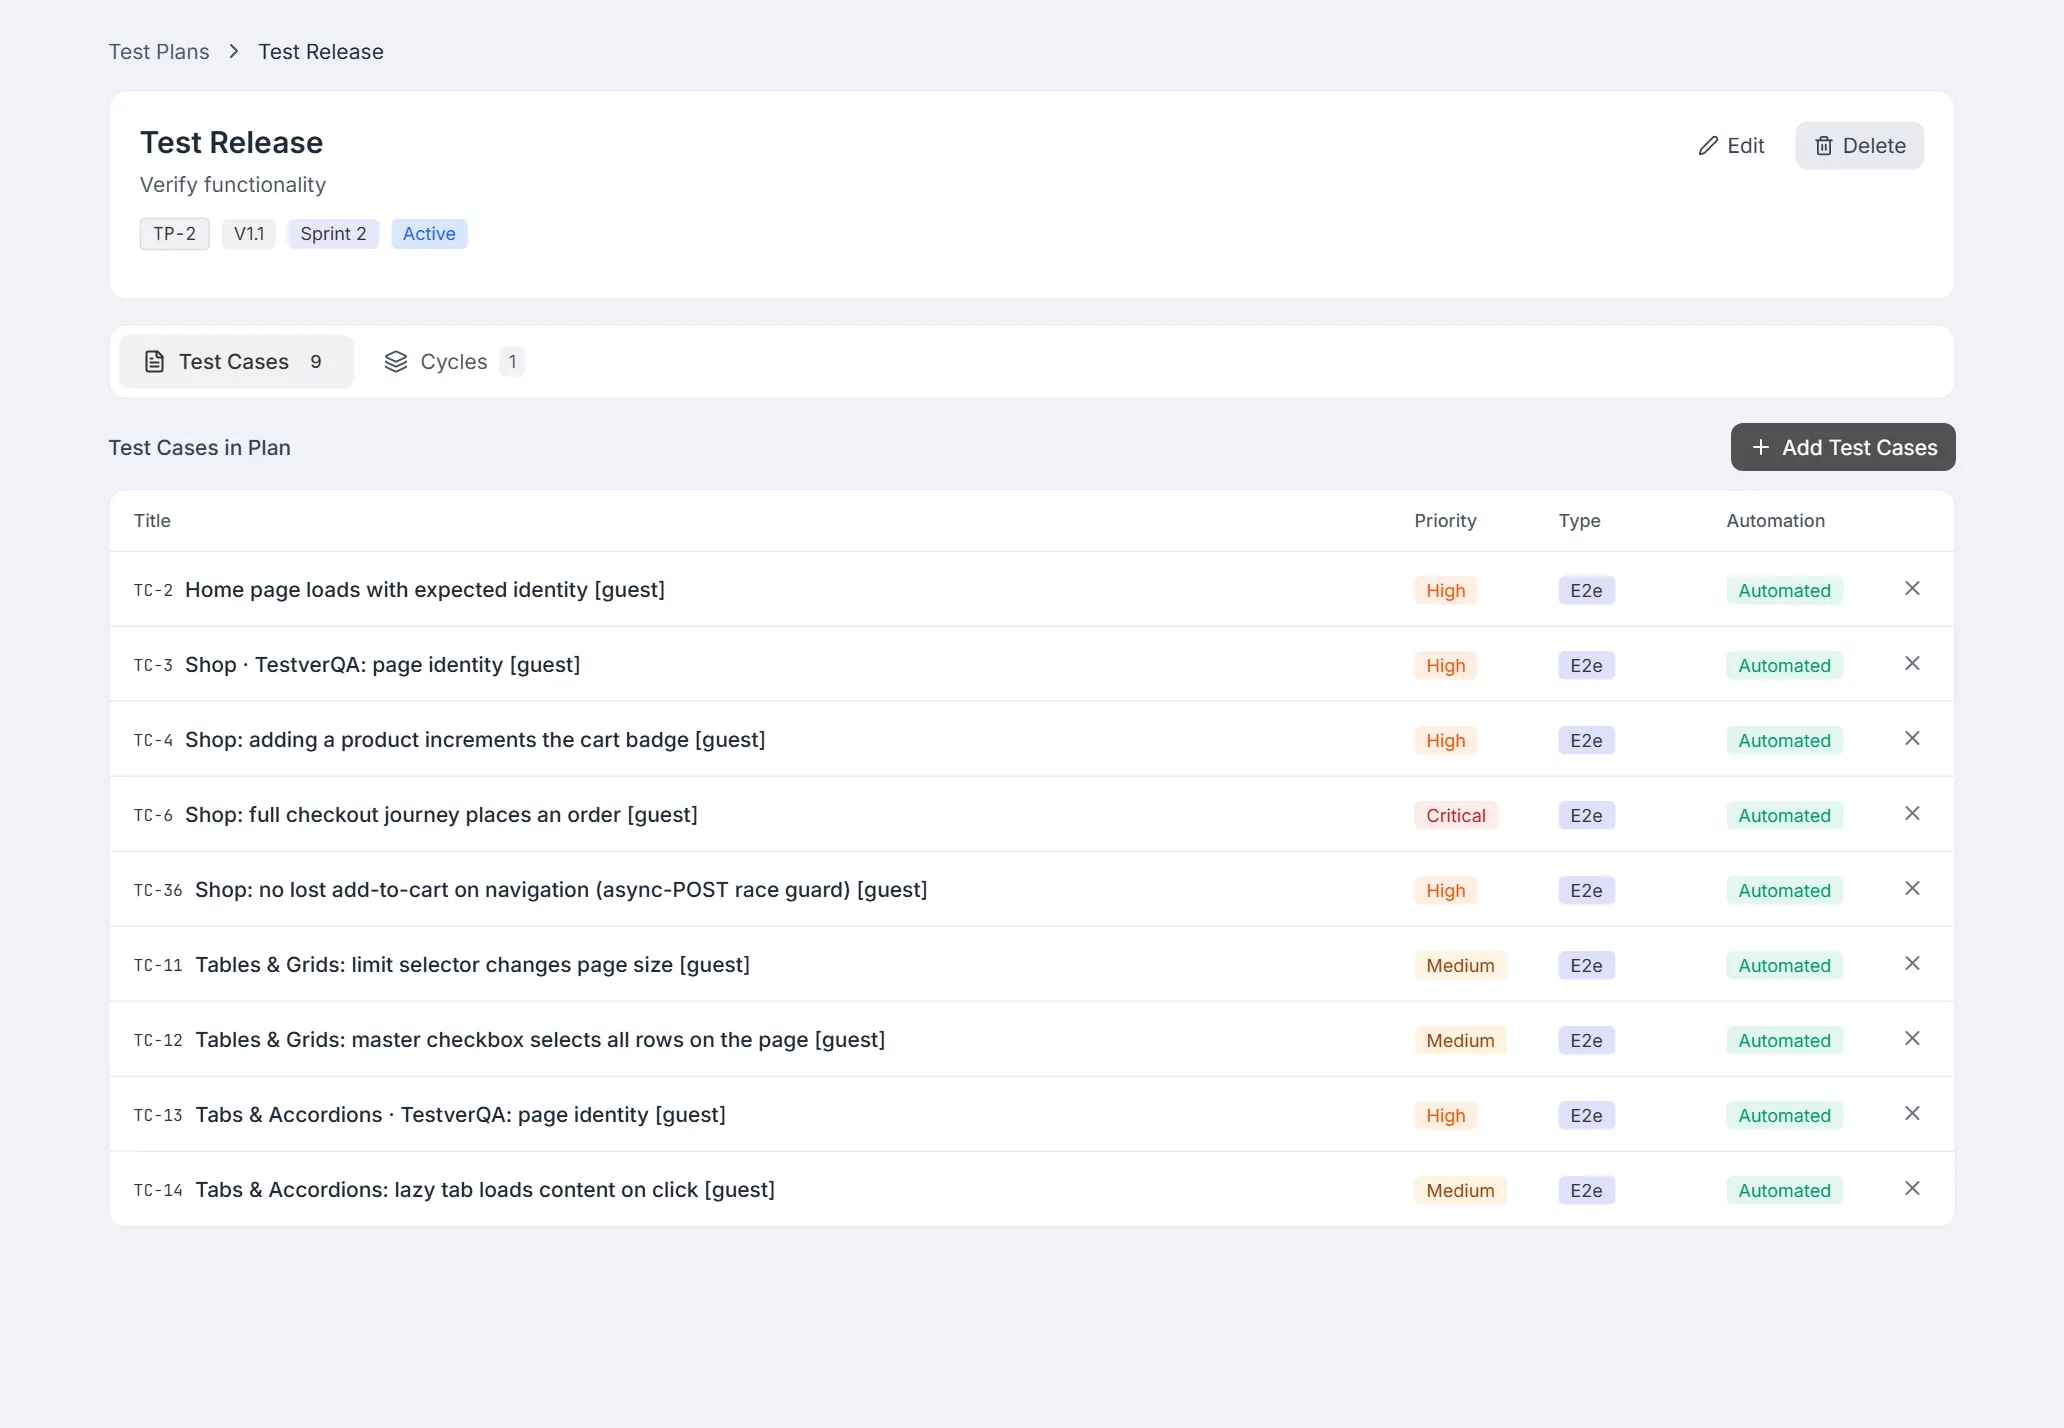
The Test Cases tab lists the cases currently in the plan in a table:
| Column | Shows |
|---|---|
| Title | Test case ID (monospace) + title, with the optional code beneath. |
| Priority | Colored priority badge. |
| Type | Colored type badge. |
| Automation | Automated (green), Needs Update (amber), or Manual (gray). |
| Remove (X) | Removes the case from this plan. |
Creating a cycle
Section titled “Creating a cycle”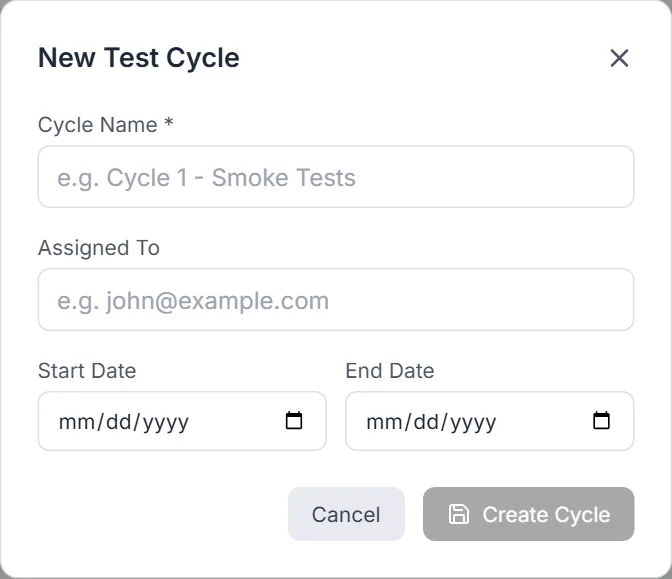
Cycles are how you actually run a plan. Each cycle is a dated round with an optional owner. Create one from the Cycles tab.
- Open the plan and switch to the Cycles tab.
- Click New Cycle (or Create Cycle in the empty state).
- Fill the cycle fields and click Create Cycle.
| Cycle field | Required | Notes |
|---|---|---|
| Cycle Name | Yes | e.g. “Cycle 1 - Smoke Tests.” Save stays disabled until filled. |
| Assigned To | No | Free-text owner, e.g. an email. Shown with a people icon on the cycle card and header. |
| Start Date | No | Date picker. |
| End Date | No | Date picker. Drives the time-remaining / Overdue badge on the cycle card. |
Executing a Plan / Cycle
Section titled “Executing a Plan / Cycle”The cycle card
Section titled “The cycle card”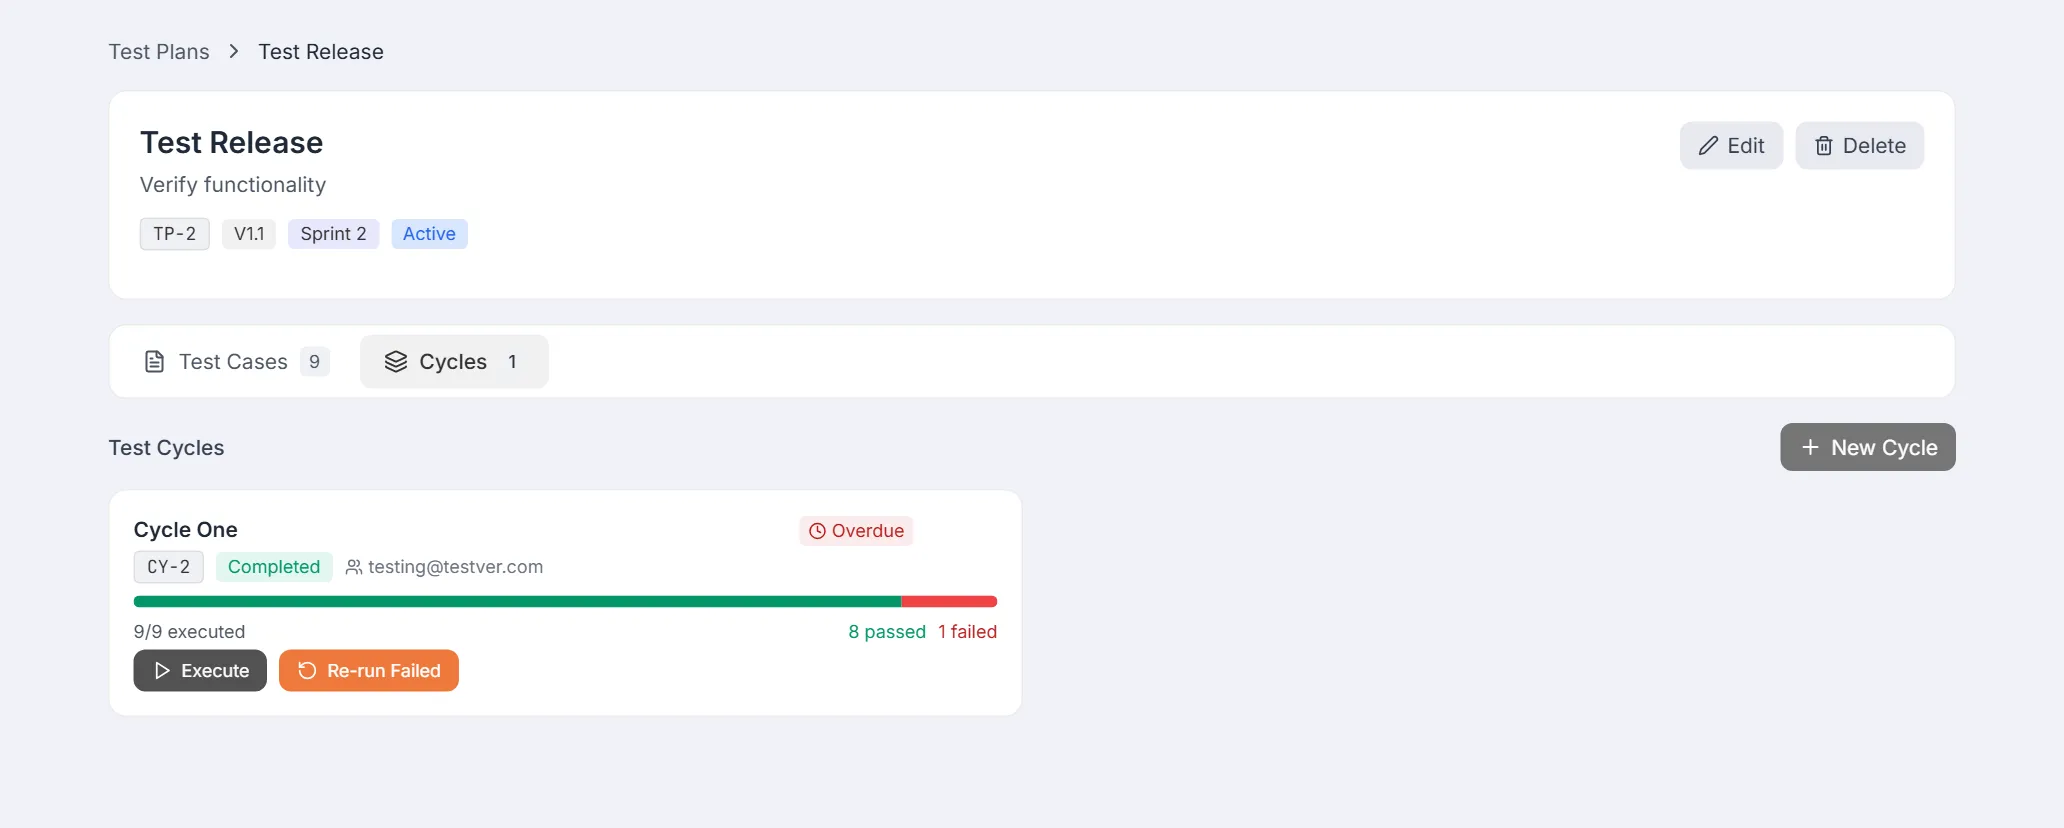
- On the Cycles tab, find the cycle card. It shows the cycle name, ID, status, assignee, a mini progress bar, an executed/total line, and a time-remaining or Overdue badge.
- Click Execute to open the Cycle Execution view.
- If the cycle has failures, a Re-run Failed button also appears on the card (see 5.7).
- Hover the card to reveal Edit (pencil) and Delete (trash). Edit reopens the cycle form as Edit Cycle; Delete asks for confirmation and permanently removes the cycle and all its execution results.
The Cycle Execution summary
Section titled “The Cycle Execution summary”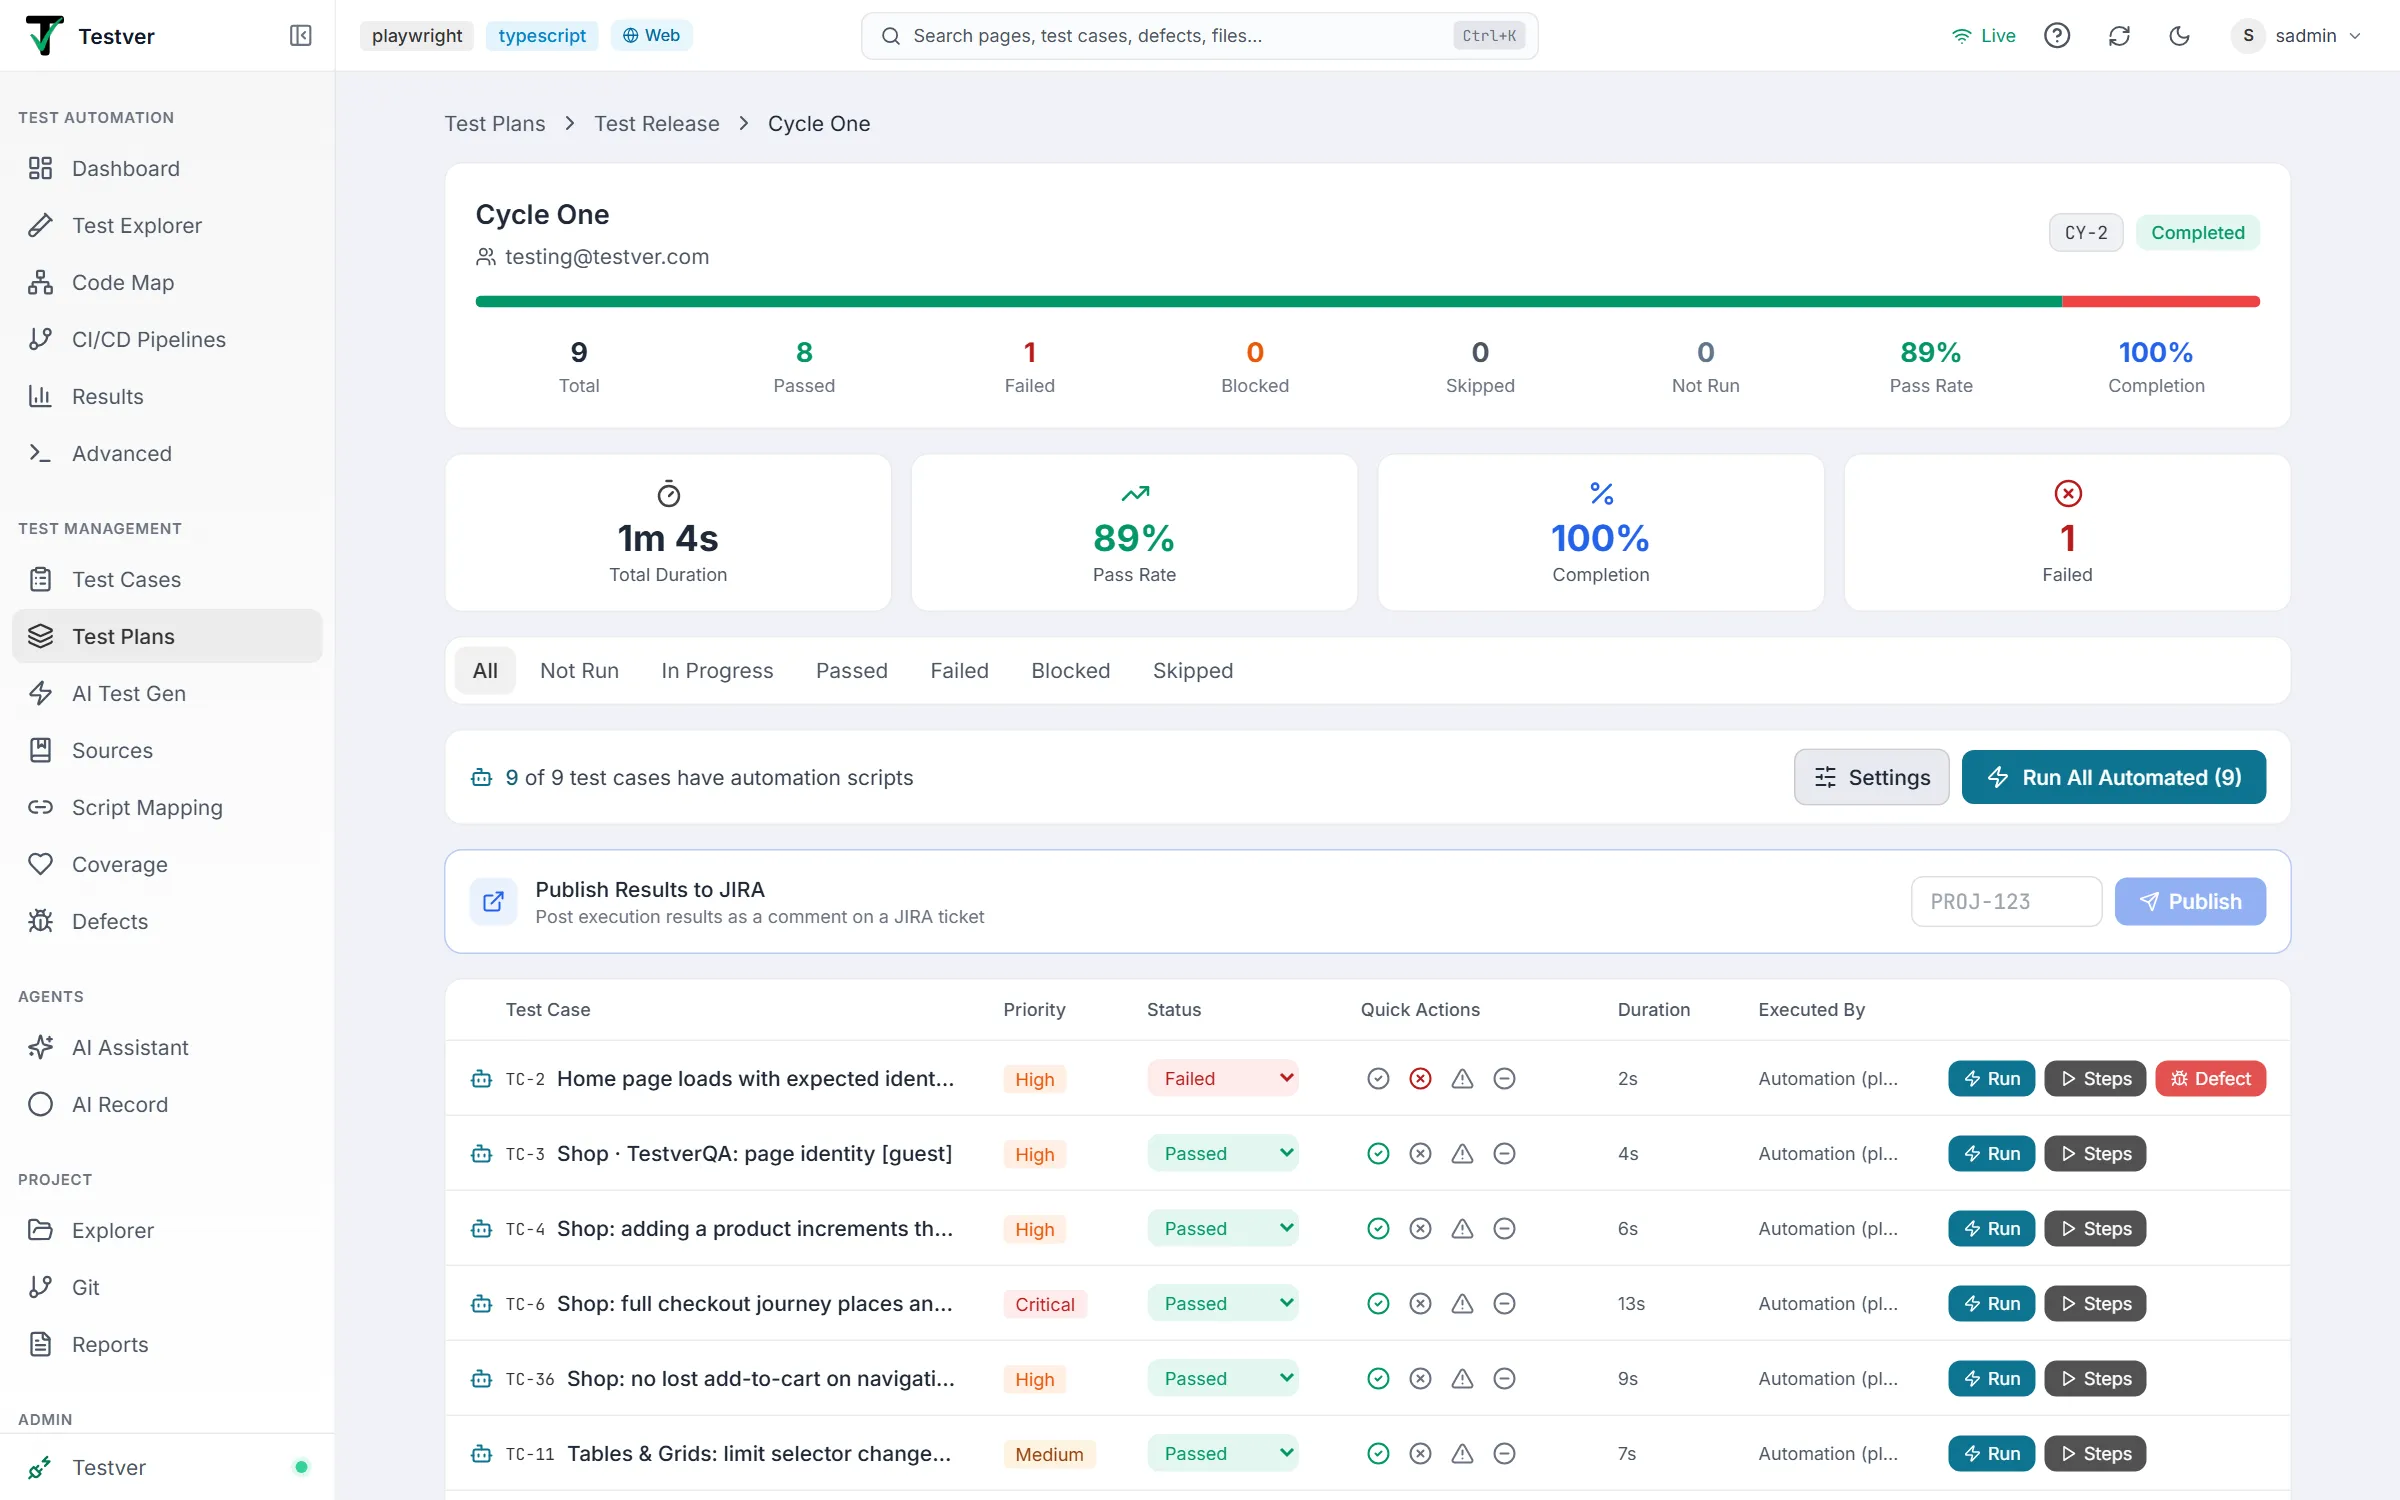

At the top of the Cycle Execution view, a summary header shows the cycle name, assignee, ID, and status, a full-width status distribution bar colored by execution outcome, and a stats grid:
| Stat | Meaning |
|---|---|
| Total | Number of executions (test cases) in the cycle. |
| Passed | Executions marked Passed. |
| Failed | Executions marked Failed. |
| Blocked | Executions marked Blocked. |
| Skipped | Executions marked Skipped. |
| Not Run | Executions not yet executed. |
| Pass Rate | Passed / Total as a percentage. |
| Completion | (Total - Not Run) / Total as a percentage. |
The analytics panel
Section titled “The analytics panel”
Below the summary, a four-tile analytics panel summarizes the cycle:
| Tile | Meaning |
|---|---|
| Total Duration | Sum of execution durations, formatted as hours/minutes/seconds. |
| Pass Rate | Percentage of executed tests that passed. |
| Completion | Percentage of tests that are no longer Not Run. |
| Failed | Count of failed executions. |
The execution list
Section titled “The execution list”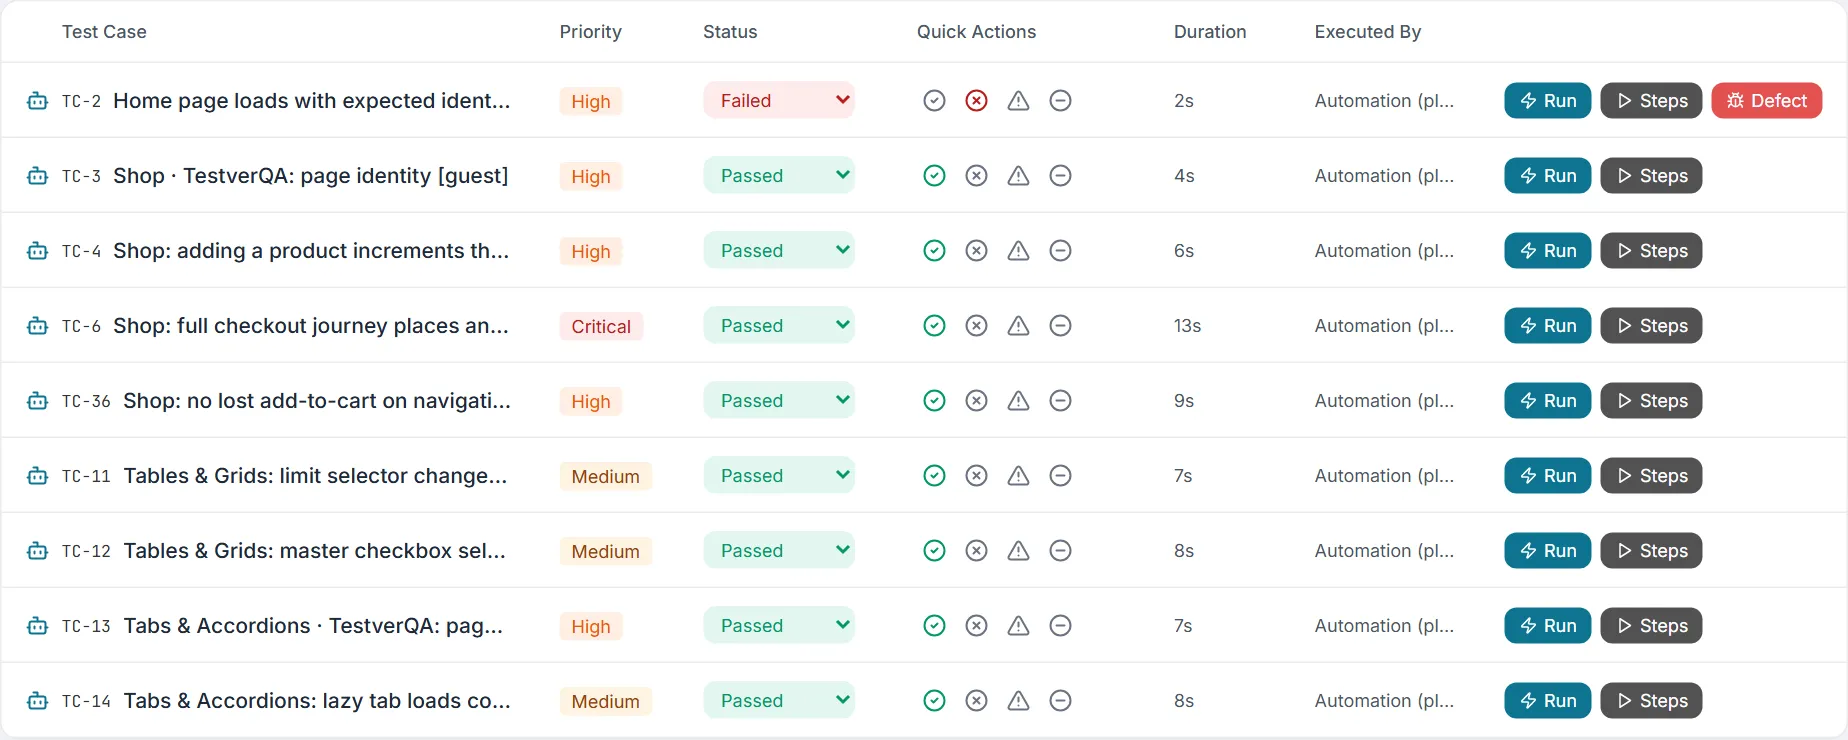
The execution list is a table with one row per test case. Each row carries the test case’s automation indicator (a bot icon for automated, an “M” for manual), ID + title, priority, status, quick-action buttons, duration, and who executed it. There are two ways to set a status:
- Status dropdown — pick any status directly from the colored select in the Status column.
- Quick Actions — click one of four icon buttons to set Pass, Fail, Block, or Skip in one click.
| Status | Icon / color | When to use it |
|---|---|---|
| Passed | Green check | The test case behaved exactly as expected. |
| Failed | Red X | The test produced a wrong result or an error. |
| Blocked | Orange warning triangle | The test could not be run — a dependency, environment, or earlier failure stops it. |
| Skipped | Gray minus circle | The test was intentionally not run this cycle (out of scope, deferred). |
| In Progress | Blue | Set automatically/while a run is underway; indicates work started but not finished. |
| Not Run | Slate | The default starting state before anyone touches the test case. |
Running steps manually
Section titled “Running steps manually”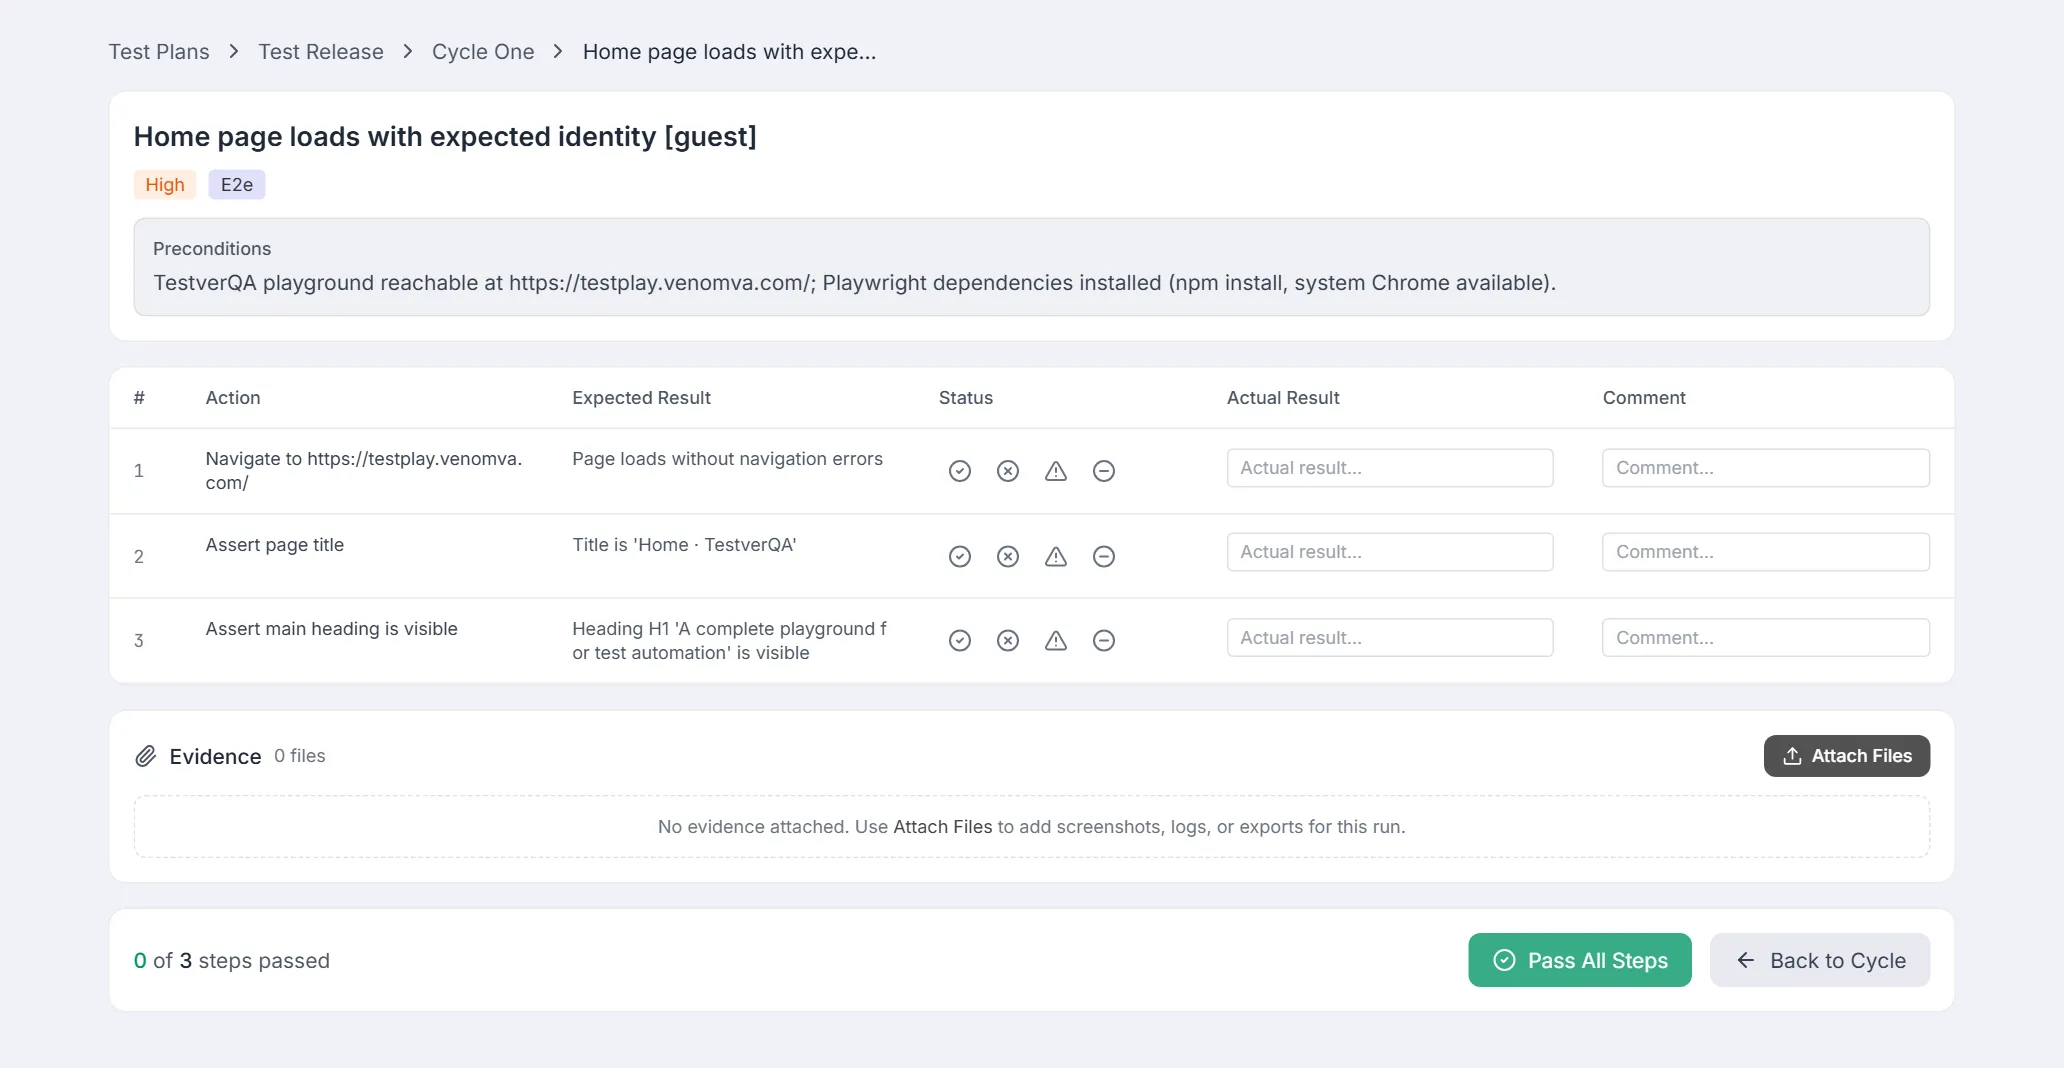
For a thorough manual run, click Steps on an execution row to open the Step Execution view for that one test case.
The header shows the test case title, its priority and type badges, and any Preconditions. Below it is the steps table:
| Column | What you do |
|---|---|
| # | Step number (read-only). |
| Action | The instruction to perform (read-only). |
| Expected Result | What should happen (read-only). |
| Status | Click Pass / Fail / Block / Skip for this single step. |
| Actual Result | Type what actually happened; saved when you click away (on blur). |
| Comment | Type a note for this step; saved on blur. |
Each row tints to match its status (faint green/red/orange/gray). At the bottom a counter reads “N of M steps passed.” Helpful shortcuts and actions on this screen:
| Button | Effect |
|---|---|
| Pass All Steps | Marks every step in this execution as Passed at once. |
| Create Defect (N failed) | Appears when there are failed steps and no defect yet; opens a bug capturing all failed step details. Once created, a colored defect ID + status badge replaces the button. |
| Back to Cycle | Returns to the Cycle Execution list. |
Attaching evidence
Section titled “Attaching evidence”Below the steps table, the Evidence section lets you attach proof for this specific run.
- Click Attach Files and choose one or more files (screenshots, logs, exports).
- Each file is uploaded and listed with its name, size, who uploaded it, and the timestamp.
- Use the Download icon to retrieve a file, or the Trash icon (with a confirmation) to remove it.
Defects can also be raised from the cycle list itself: any execution that is Failed or Blocked shows a red Defect button in its Quick Actions column. Clicking it creates a bug from that execution. Once a defect exists, the row shows a colored badge with the defect ID and its status (Open / In Progress / Resolved / Closed / Rejected) instead of the button.
Running automated tests
Section titled “Running automated tests”
Test cases that have a mapped automation script show a cyan bot icon. When at least one mapped case exists, an automation bar appears above the list reading “N of M test cases have automation scripts” with a Settings button and a Run All Automated (N) button.
| Control | Effect |
|---|---|
| Run (per row) | Runs that one mapped script; the button shows a spinner and “Running” while active, then the status updates with the result. |
| Run All Automated (N) | Runs every mapped script in the cycle — one at a time unless you raise Concurrency in the run settings; manual cases are skipped. Confirmed by a dialog first. |
| Settings | Opens the Automation Run Settings dialog (below). Disabled while a run is in progress. |
Automation Run Settings
Section titled “Automation Run Settings”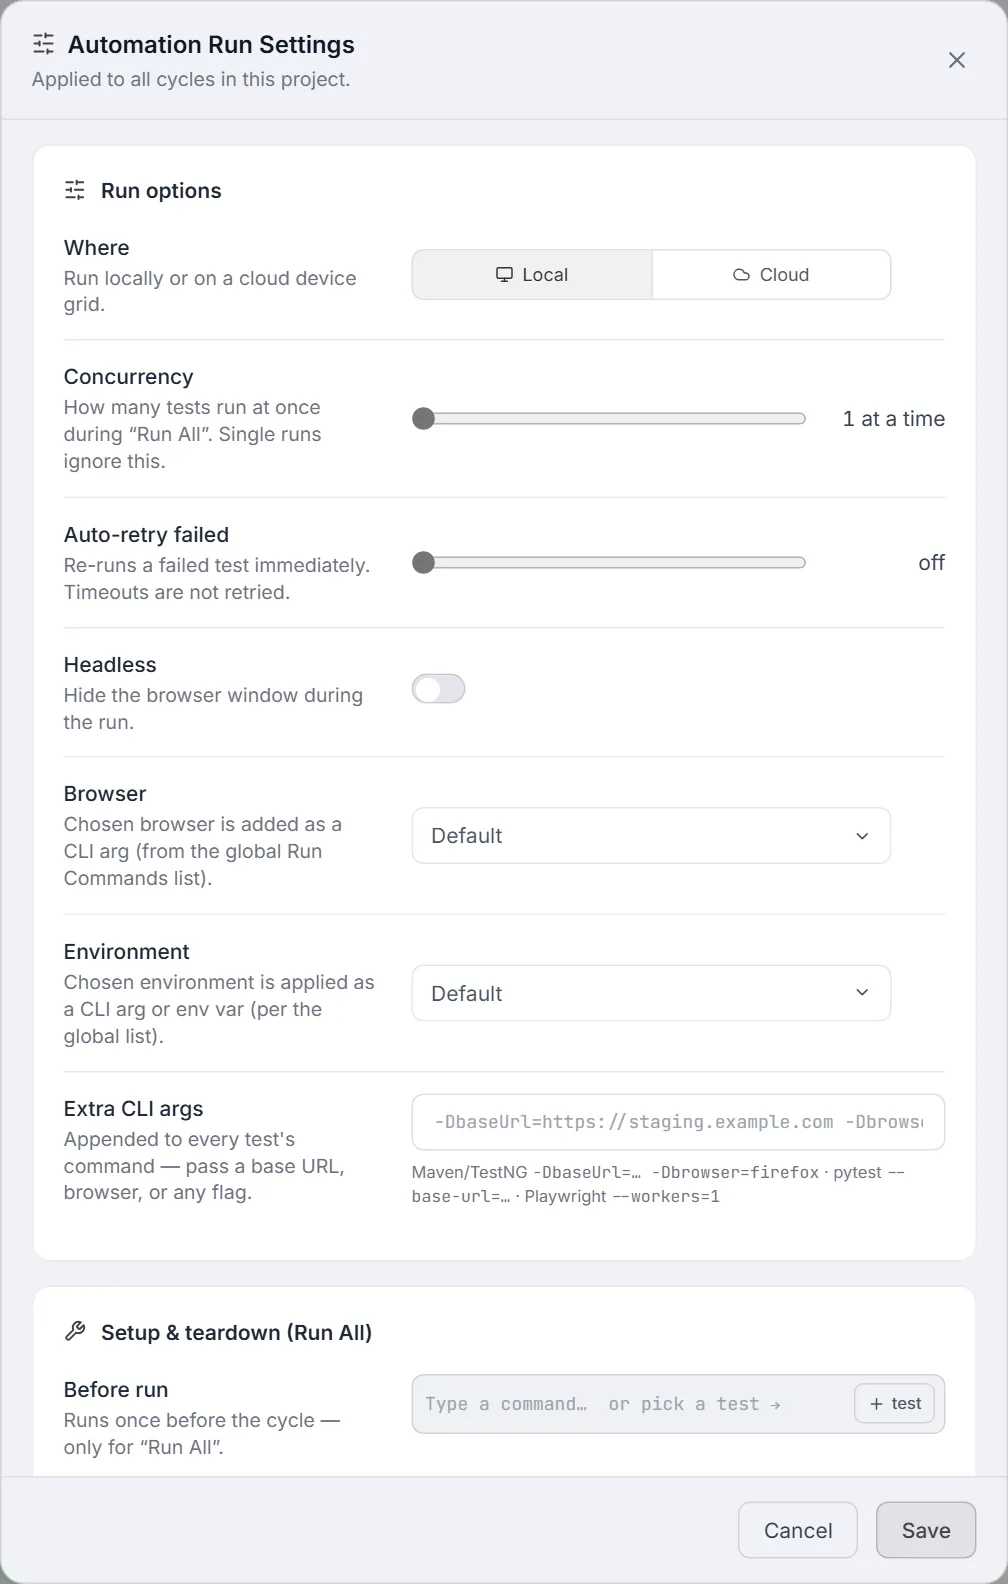
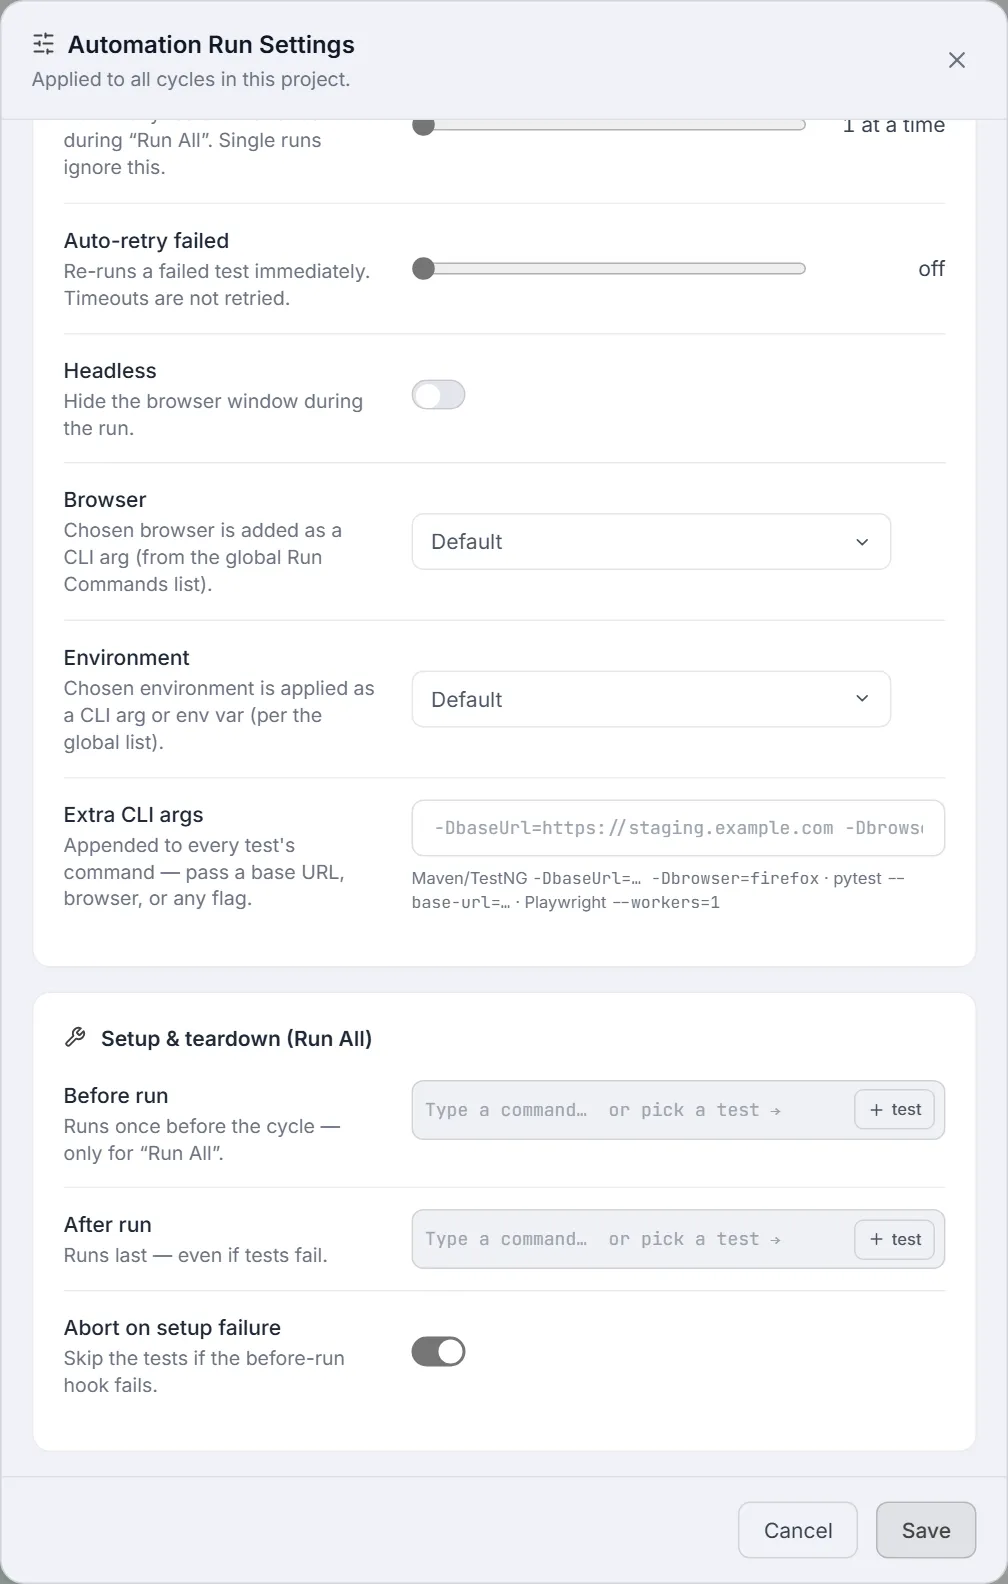
The Settings button opens Automation Run Settings. As the dialog says, the settings are applied to all cycles in this project. Click Save to keep your changes, or Cancel / × to close without saving.
| Setting | What it does |
|---|---|
| Where | Local or Cloud (a cloud device grid). Choosing Cloud adds a Provider dropdown listing your enabled cloud providers. In a mobile workspace this row is replaced by a Device & App picker. |
| Concurrency | How many tests run at once during Run All, from 1 to 8. Single runs ignore it. |
| Auto-retry failed | Re-runs a failed test immediately, up to 3 times (off by default). Timeouts are not retried. |
| Headless | Hides the browser window during the run (web workspaces only). |
| Browser | Adds the chosen browser as a CLI argument, from the global Run Commands list. Shown when browsers are configured. |
| Environment | Applies the chosen environment as a CLI argument or environment variable, per the global list. Shown when environments are configured. |
| Extra CLI args | Appended to every test’s command — for example a base URL, a browser, or any framework flag. |
| Before run | A command, or a project test picked with + test, that runs once before the cycle — Run All only. |
| After run | A command or test that runs last, even if tests fail — Run All only. |
| Abort on setup failure | Skips the tests when the before-run hook fails (on by default). |
When a mapped script runs on Testver Grid, its browser appears live under that test case’s row — a thumbnail you can click to enlarge, the same live execution view the Runner, Test Explorer and Results use. It shows one running test at a time and disappears when that test finishes; the enlarged view closes itself when the browser is released.
Filtering executions by status
Section titled “Filtering executions by status”
A row of filter tabs above the list — All, Not Run, In Progress, Passed, Failed, Blocked, Skipped — narrows the table to executions in that status, which is handy for working through just the failures or just the not-yet-run cases.
Re-running failed tests
Section titled “Re-running failed tests”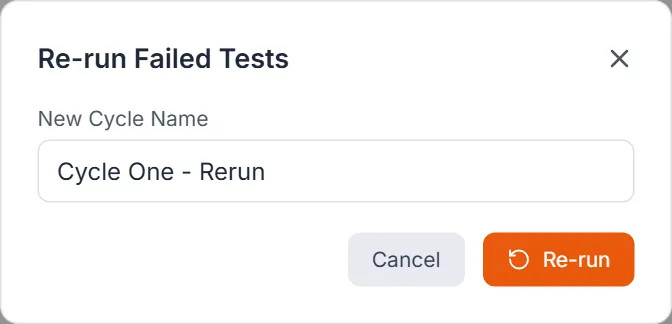
When a cycle has failures, its card shows a Re-run Failed button.
- On the Cycles tab, click Re-run Failed on a cycle that has failures.
- A dialog asks for a New Cycle Name (pre-filled as “<cycle name> - Rerun”).
- Click Re-run. A new cycle is created containing only the failed test cases, ready to retest.
Results & Reports
Section titled “Results & Reports”How results roll up
Section titled “How results roll up”Results roll up automatically through the three levels, so you never have to total anything by hand:
- Execution -> a single status (and optional step-level pass/fail).
- Cycle -> the summary header stats, the status distribution bar, and the analytics tiles (Total Duration, Pass Rate, Completion, Failed).
- Plan -> each plan card’s progress bar and “executed / total” line aggregate across all of the plan’s cycles.
Publishing results to JIRA
Section titled “Publishing results to JIRA”
If a JIRA connector is configured, a Publish Results to JIRA panel appears inside the Cycle Execution view. It posts a formatted summary comment onto a JIRA ticket.
- Confirm or type the JIRA issue key (e.g.
PROJ-123). If the plan name contains a key, it is auto-detected and pre-filled. - Click Publish.
- A comment is posted containing an overall PASSED/FAILED line, plan and cycle names, the date, a passed/failed/skipped/blocked summary, the pass rate, and a per-test-case list with status emoji.
- On success the button switches to a green Published state.
About exports & reporting
Section titled “About exports & reporting”This screen does not provide a separate downloadable PDF/CSV report button or a standalone exports tab. Reporting here is the in-place roll-up (cards, header stats, analytics tiles) plus the JIRA comment publish. Linked defects created from failed/blocked executions carry the detailed failure record into your defect tracking.
Common Tasks (How Do I…?)
Section titled “Common Tasks (How Do I…?)”| I want to… | Do this |
|---|---|
| Create a new plan | Click New Plan, enter a name (other fields optional), Create Plan. |
| Add test cases to a plan | Open the plan -> Test Cases tab -> Add Test Cases -> filter, select, Add N Test Cases. |
| Remove a test case from a plan | Plan Test Cases tab -> click the X on the row -> confirm. |
| Start a test round | Plan -> Cycles tab -> New Cycle -> name it -> Create Cycle -> Execute. |
| Mark a test passed/failed quickly | In the cycle list, click the green check / red X (or pick from the Status dropdown). |
| Run a test step by step | Click Steps on the execution row, then grade each step. |
| Pass an entire test case at once | On the Step Execution screen, click Pass All Steps. |
| Attach a screenshot as proof | Step Execution -> Evidence -> Attach Files. |
| Log a bug for a failure | Cycle list: click Defect on a failed/blocked row, or Create Defect on the step screen. |
| Retest only the failures | Cycle card -> Re-run Failed -> name the new cycle -> Re-run. |
| Run automated tests | In the cycle, click Run on a row or Run All Automated in the automation bar. |
| See only failed tests | Cycle view -> click the Failed filter tab. |
| Post results to JIRA | Cycle view -> Publish Results to JIRA -> enter key -> Publish. |
| Find a plan | Use the Search plans… box and/or the status filter on the Plans List. |
| Go back a level | Use the breadcrumb trail at the top of any inner view. |
Tips & Best Practices
Section titled “Tips & Best Practices”- Name plans by release or feature. Putting a JIRA key in the plan name unlocks JIRA auto-detection when publishing results.
- Add all cases before creating the cycle. A cycle snapshots the plan at creation time; cases added later do not flow into existing cycles.
- Use cycles, not new plans, for repeated rounds. Keep one plan and create a fresh cycle (Smoke, Regression, Re-sit) for each run so history stays together.
- Set end dates. They drive the time-remaining and Overdue badges, giving the team an at-a-glance deadline view.
- Capture evidence as you go. Attach screenshots/logs at the moment of failure while context is fresh; evidence is per-execution.
- Grade steps for important cases. The step view gives precise pass/fail per step and feeds a richer defect when something breaks.
- Use the status filter tabs to divide work. Filter to Not Run to see what’s left, or Failed to focus a retest.
- Re-run Failed instead of editing. It creates a clean cycle with just the failures so your original results stay intact as a record.
- Lean on Pass All Steps for cases that clearly passed end-to-end, then spot-check rather than clicking every step individually.
Troubleshooting & FAQ
Section titled “Troubleshooting & FAQ”| Problem / Question | Answer |
|---|---|
| A test case I added to the plan isn’t in my cycle | Cycles snapshot the plan when created. Add the case first, then create a new cycle (or re-run) to include it. |
| I can’t click Create / Update | The Plan Name (or Cycle Name) field is empty. Names are required; fill it in and the button enables. |
| A case is missing from the Add Test Cases picker | It is probably already in the plan (duplicates are excluded), or it’s filtered out — check the search box and filter row, then Clear the filters. |
| Removing a case wiped its results | Expected. Removing a case from a plan clears its executions in every cycle of that plan. The case stays in the catalog. The confirm dialog warns about this. |
| I deleted a plan by mistake | Deletion is permanent and removes all cycles and history; there is no undo. Recreate the plan and re-add the cases. |
| The Run / Run All button isn’t showing | Only test cases with a mapped automation script can be run here (cyan bot icon). Manual cases show an “M” and are run via Steps. |
| The Publish to JIRA panel is missing | It only appears when a JIRA connector is configured for your workspace. |
| My typed Actual Result / Comment didn’t save | These save on blur — click out of the field (or move to another) and the value is stored. |
| My evidence file was skipped | Files over 25 MB are skipped with a warning. Compress or split the file under the limit. |
| Status changed but stats didn’t move | Stats and analytics refresh from execution status; for automated runs they auto-refresh as runs complete. If needed, leave and re-open the cycle. |
| What does Blocked vs Skipped mean? | Blocked = couldn’t run due to an obstacle (dependency/environment). Skipped = intentionally not run this round. |
| A cycle says Overdue | Its End Date has passed. Edit the cycle to extend the date, or finish/close it out. |
Related
Section titled “Related”- Test Cases — what plans contain.
- Defects — file defects from failed executions.
- Runner — runs the automated parts of a cycle.
- Results — full automation results.