

A 5-minute tour
This is a quick orientation to the whole product. Open Testver alongside this page and follow along — in about five minutes you’ll know where everything lives and how to jump between screens fast.
Introduction
Section titled “Introduction”How to use this tour
Section titled “How to use this tour”You don’t need to read every linked page now. The goal is a mental map: what the three regions of the screen are, what each sidebar group contains, which screens hold several tools behind tabs, and the two keyboard shortcuts that make navigation instant. Each item links to its full guide for when you need the detail.
The layout
Section titled “The layout”Three regions are always visible:
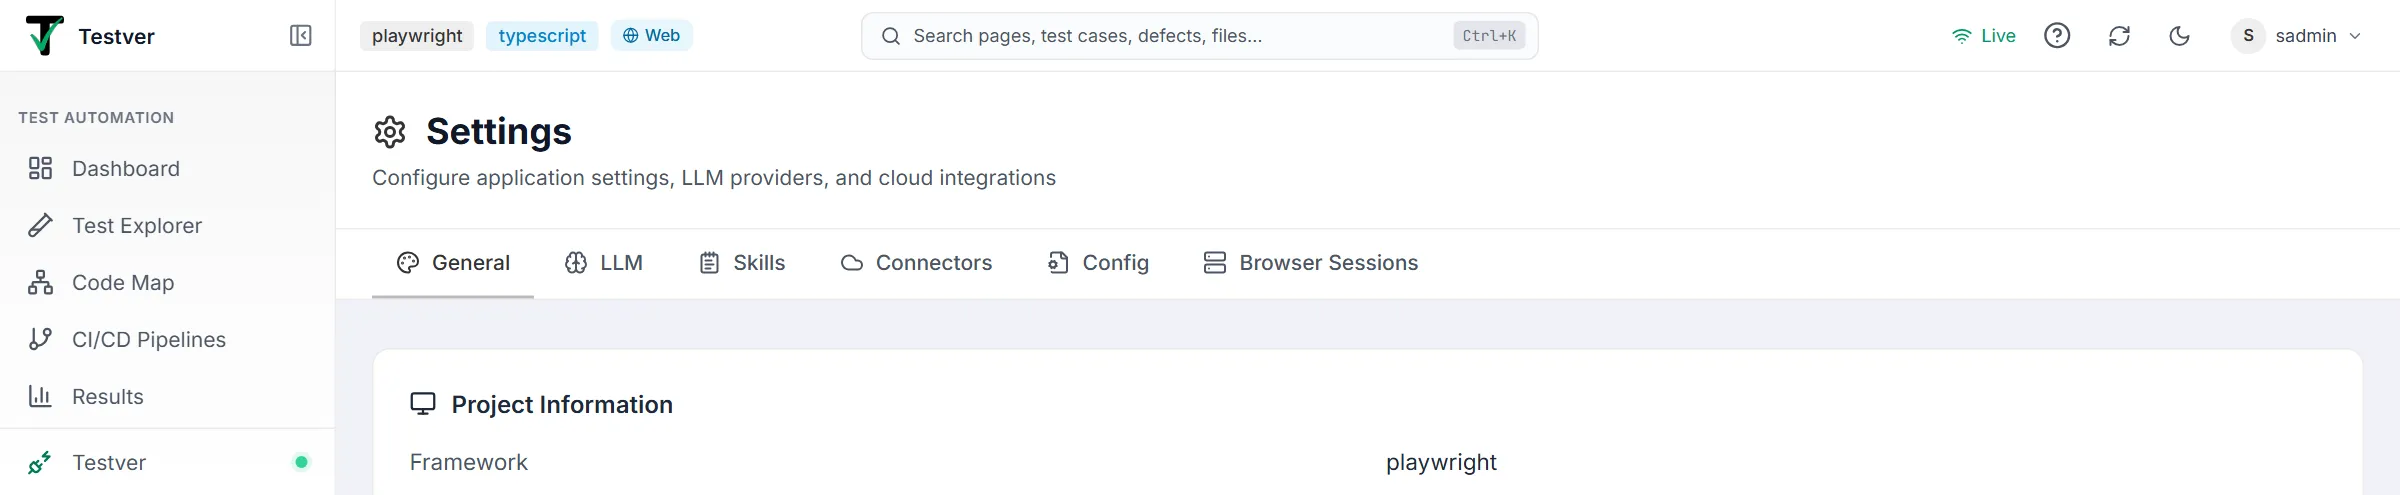
- Top header — the Testver logo, the collapse-sidebar button, your project’s detected framework and language, the app-mode chip, the search field, and the controls below.
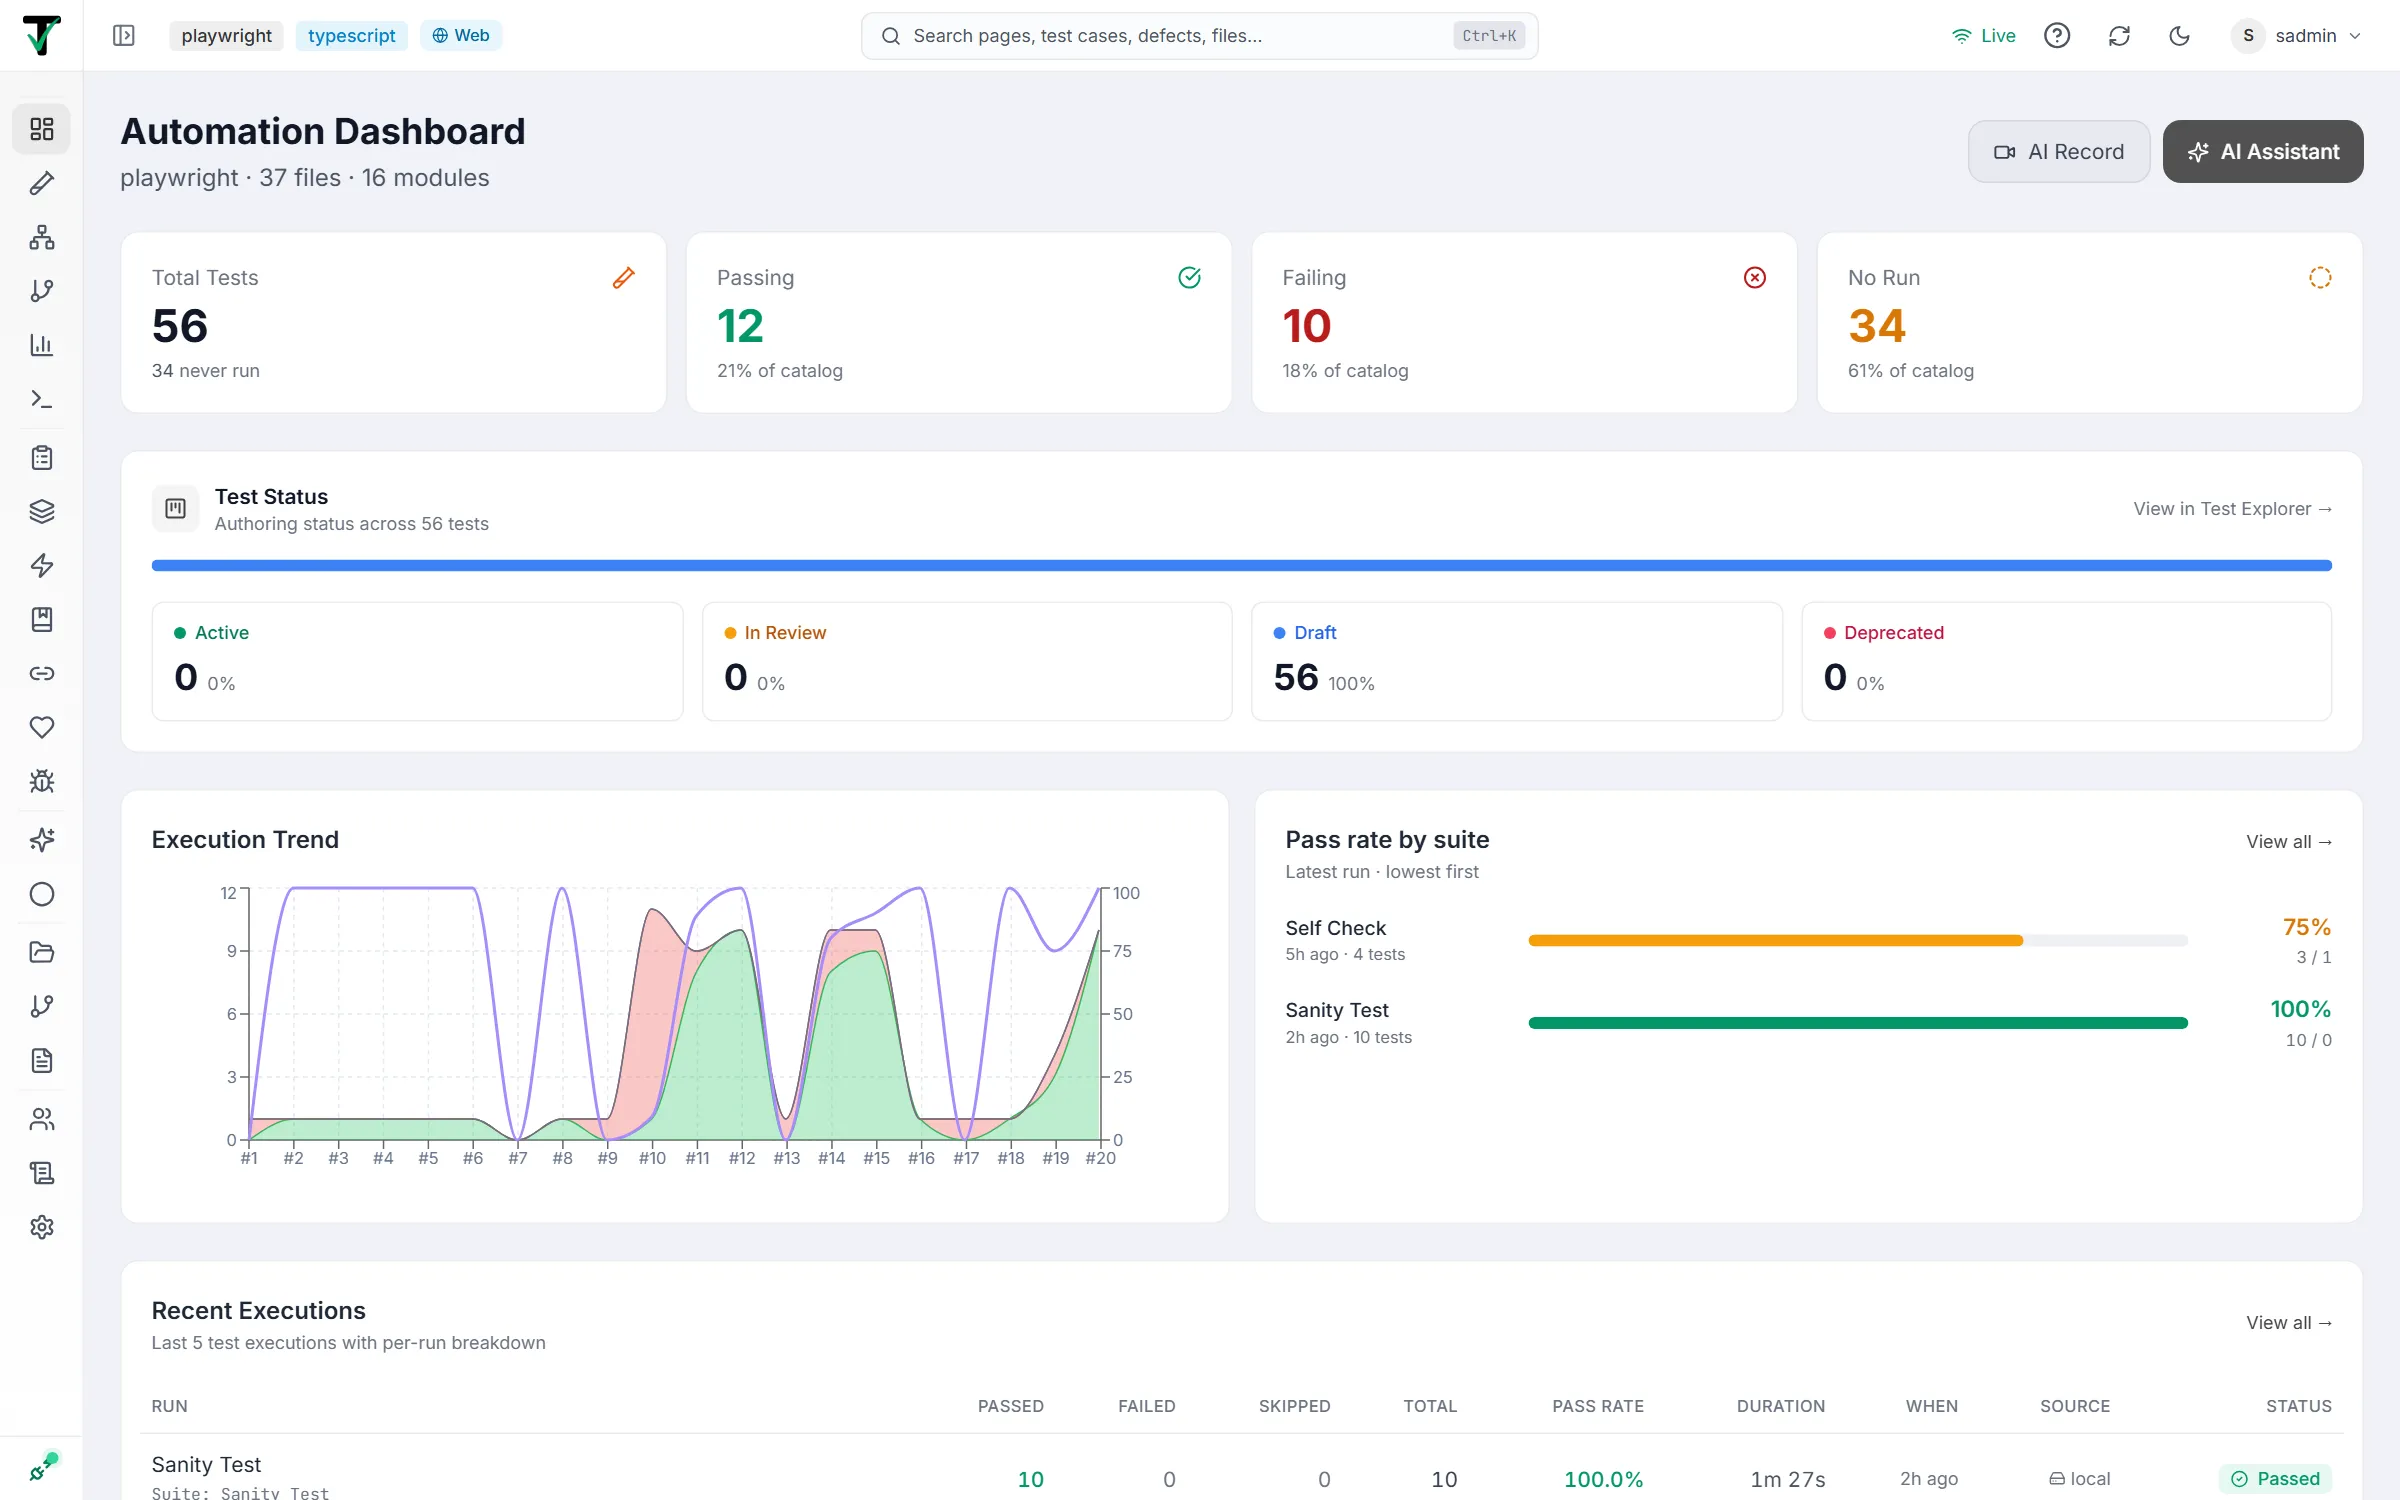
- Left sidebar — every section of the app, grouped. Collapse it any time with the Collapse sidebar button next to the logo in the header, or Ctrl + B. The Testver entry is pinned at the very bottom — it opens the Testver screen with its Connections and About tabs.
- Main area — the active screen you’re working in.
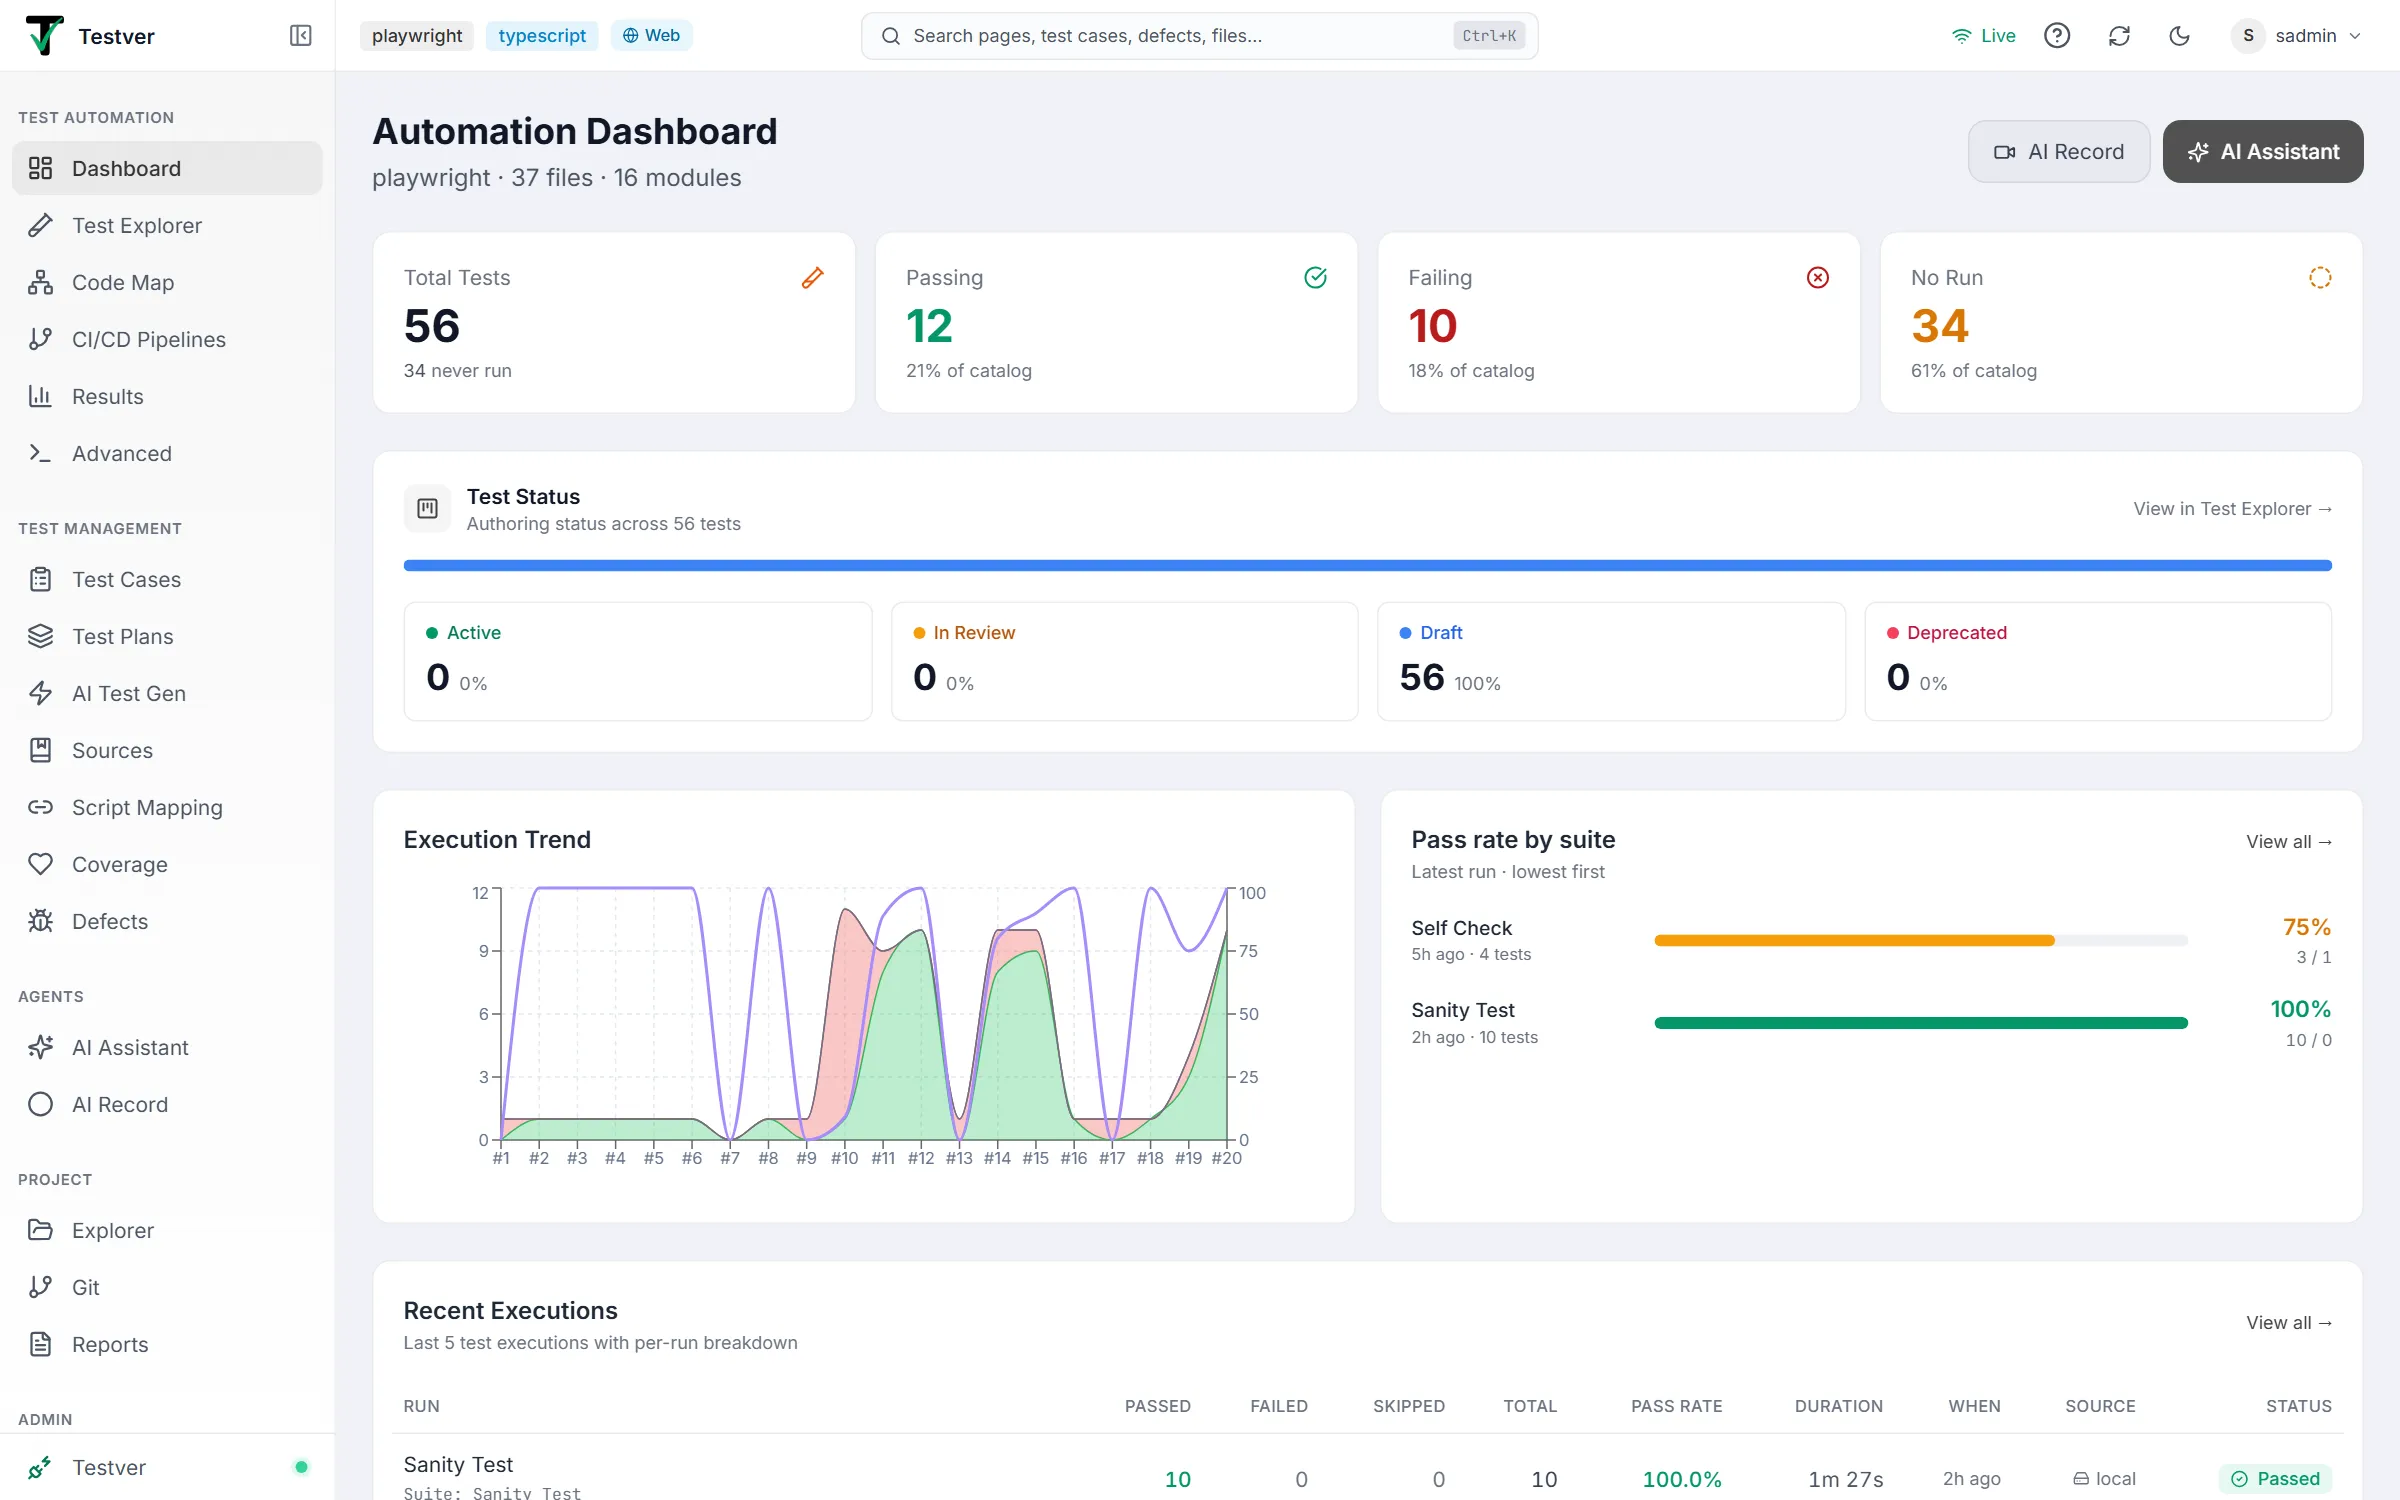
What’s in the header
Section titled “What’s in the header”Left to right:



| Control | What it tells you / does |
|---|---|
| Testver logo | The product mark. |
| Collapse sidebar button | Collapses the sidebar to an icon rail (Ctrl + B); click it again (Expand sidebar) to bring the labels back. |
| Framework & language badges | What Testver detected in your project — a quick confirmation it loaded the right codebase. |
| App-mode chip | Web, Mobile (Beta), or Both — which surfaces the workspace shows. Hover it for a reminder that you change it in Settings → General. |
Search field (Ctrl + K) | Search pages, test cases, defects, files… — opens the Command Palette. |
| Live / Offline | Whether the browser is connected to the Testver server. If this reads Offline, live output and progress won’t update. |
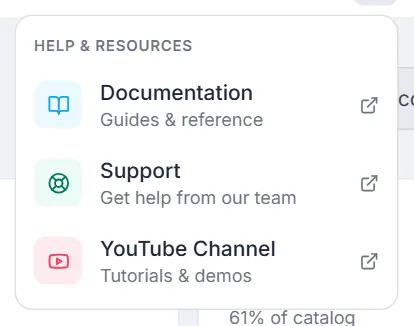
| Help (?) | Help & Resources — Documentation, Support and YouTube Channel, each opening in a new tab. |
| Rescan | Rescan project — re-scans the project for new or moved test files. |
| Theme toggle | Moon / sun icon — switch between light and dark. |
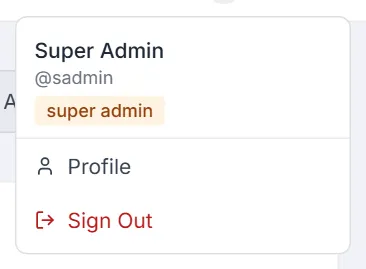
| Your avatar | The user menu — your display name, username and role, then Profile and Sign Out. |
The Help (?) menu and the avatar’s user menu:

Collapsed (Ctrl + B), the sidebar shrinks to icons and the main area gets the extra width:
The sidebar groups
Section titled “The sidebar groups”The sidebar organises every screen into groups — four for most users, plus Admin if you are an Admin or the Super admin. The Testver entry sits below them all. Here’s what each is for.
1. Test Automation
Section titled “1. Test Automation”For automated test scripts — discovering, running, and analysing them.
- Dashboard — at-a-glance status of your latest runs.
- Test Explorer — every test file/spec in your project, browseable.
- Code Map — a structural X-ray of your automation code and test data.
- CI/CD Pipelines — let CI/CD pipelines trigger runs on your Testver server and gate builds on the result.
- Results — full history of every run, with screenshots and steps.
- Advanced — run a command now (Runner tab) or on a schedule (Schedules tab).
2. Test Management
Section titled “2. Test Management”For the QA-process side — cases, plans, defects, and coverage.
- Test Cases — your manual test catalog.
- Test Plans — group tests into plans and run them in cycles.
- AI Test Gen — generate test cases from requirements or scripts.
- Sources — requirements, notes, JIRA tickets, documents.
- Script Mapping — link manual test cases to the automation that covers them.
- Coverage — what’s tested and what isn’t.
- Defects — the built-in bug tracker.
3. Agents
Section titled “3. Agents”Testver’s AI surfaces — where you talk to the assistant and record tests by doing them.
- AI Assistant — chat that helps you write, fix, and analyse tests.
- AI Record — record clicks in a browser or taps on a phone and get tests generated.
Import / Export has no sidebar entry of its own — it opens from a button on the Test Cases screen, because it acts on that catalogue.
4. Project
Section titled “4. Project”Browsing your project and the world around it.
- Explorer — the file tree of the connected project.
- Git — stage, commit, and push from inside Testver.
- Reports — build reports for stakeholders.
5. Admin (admins only)
Section titled “5. Admin (admins only)”Visible only to Admins and the Super admin.
- Users — manage who has access and their roles.
- Audit Log — every meaningful action, recorded.
- Settings — the configuration console (see below).
Testver (bottom of the sidebar)
Section titled “Testver (bottom of the sidebar)”Pinned below the groups for everyone. It opens the Testver screen, which has two tabs: Connections (/testver, where you connect your Testver account) and About (/testver/about, the About screen). A green dot next to the entry means you’re connected to Testver.
Settings
Section titled “Settings”Settings is Testver’s configuration console — its tabs are General (project information, run configuration and workspace options such as the app mode), LLM, Skills, Connectors, Config (environment and config files) and Browser Sessions (live browser processes).
Where it appears in the sidebar depends on your role:
| Your role | Where Settings is | What you get |
|---|---|---|
| Tester / Viewer | Bottom of the Agents group | Every tab, but General, Skills and Connectors are read-only; the LLM tab manages your own Testver AI connection. |
| Admin / Super admin | Bottom of the Admin group | The full configuration console. |
Screens that hold several tools
Section titled “Screens that hold several tools”Some sidebar entries are one screen with tabs, not one screen with one job. It’s worth knowing which, so you don’t go looking for a missing sidebar entry:
| Sidebar entry | Its tabs |
|---|---|
| Advanced | Runner · Schedules |
| CI/CD Pipelines | Dashboard · Pipelines · CI Tokens · CI Runs · Trace |
| Code Map | Methods and Steps · Test Data |
| Settings | General · LLM · Skills · Connectors · Config · Browser Sessions |
| Test Explorer | Tests · Suites |
| Script Mapping | Dashboard · Mapped Test Cases · Map Test Cases |
| Testver (bottom of the sidebar) | Connections · About |
Power moves
Section titled “Power moves”A few interactions that make Testver much faster to use:
| Action | How | What it does |
|---|---|---|
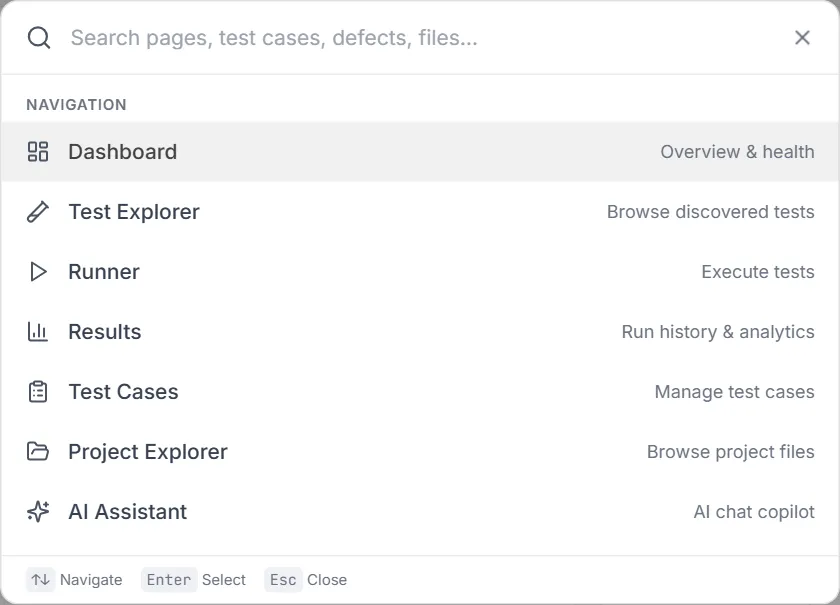
| Command Palette | Ctrl + K, or the header Search button | Search any screen by name and jump to it instantly. Both routes open the same palette. |
| Toggle sidebar | Ctrl + B | Collapse/expand the left sidebar for more room. |
| Switch theme | Top-right moon/sun icon | Light or dark — remembered in this browser. |
| Deep-link a tab | Add ?tab= to the URL | Screens with tabs keep the active tab in the address bar — for example /advanced?tab=schedules or /settings?tab=llm — so you can bookmark or share an exact view. |
| Spot an active run | Pulsing dot on Advanced | A run is executing right now; you can see it from any screen without switching. |
Three things to try right now
Section titled “Three things to try right now”- Switch theme — click the moon/sun icon top-right. Both light and dark are fully supported.
- Open the AI Assistant — you’ll see a friendly greeting and mode options. Type a question.
- Press Ctrl + K — the Command Palette opens. Type a screen name and jump straight to it.
Where to go next
Section titled “Where to go next”You’re oriented. Head to whichever matches what you want to do first:
- Have automated tests? → Test Explorer to run your first one.
- Want to run a command or suite right now? → Advanced → Runner.
- Want it to run every night? → Advanced → Schedules.
- Want to write manual test cases? → Test Cases.
- Want to generate tests from a document? → AI Test Gen.
- Want to record a test by clicking or tapping through it? → AI Record.
- Setting up the instance for a team? → Users, Settings, and the LLM tab to connect AI.
Related
Section titled “Related”- First-time setup — pick your mode and create the super admin account.
- Sign in — the daily login flow.
- Dashboard — the home screen you’ll return to most.
- Settings — connect the AI provider and configure Testver.
- About Testver — the in-app product overview, the About tab of the Testver entry pinned at the bottom of the sidebar.