

Tests tab
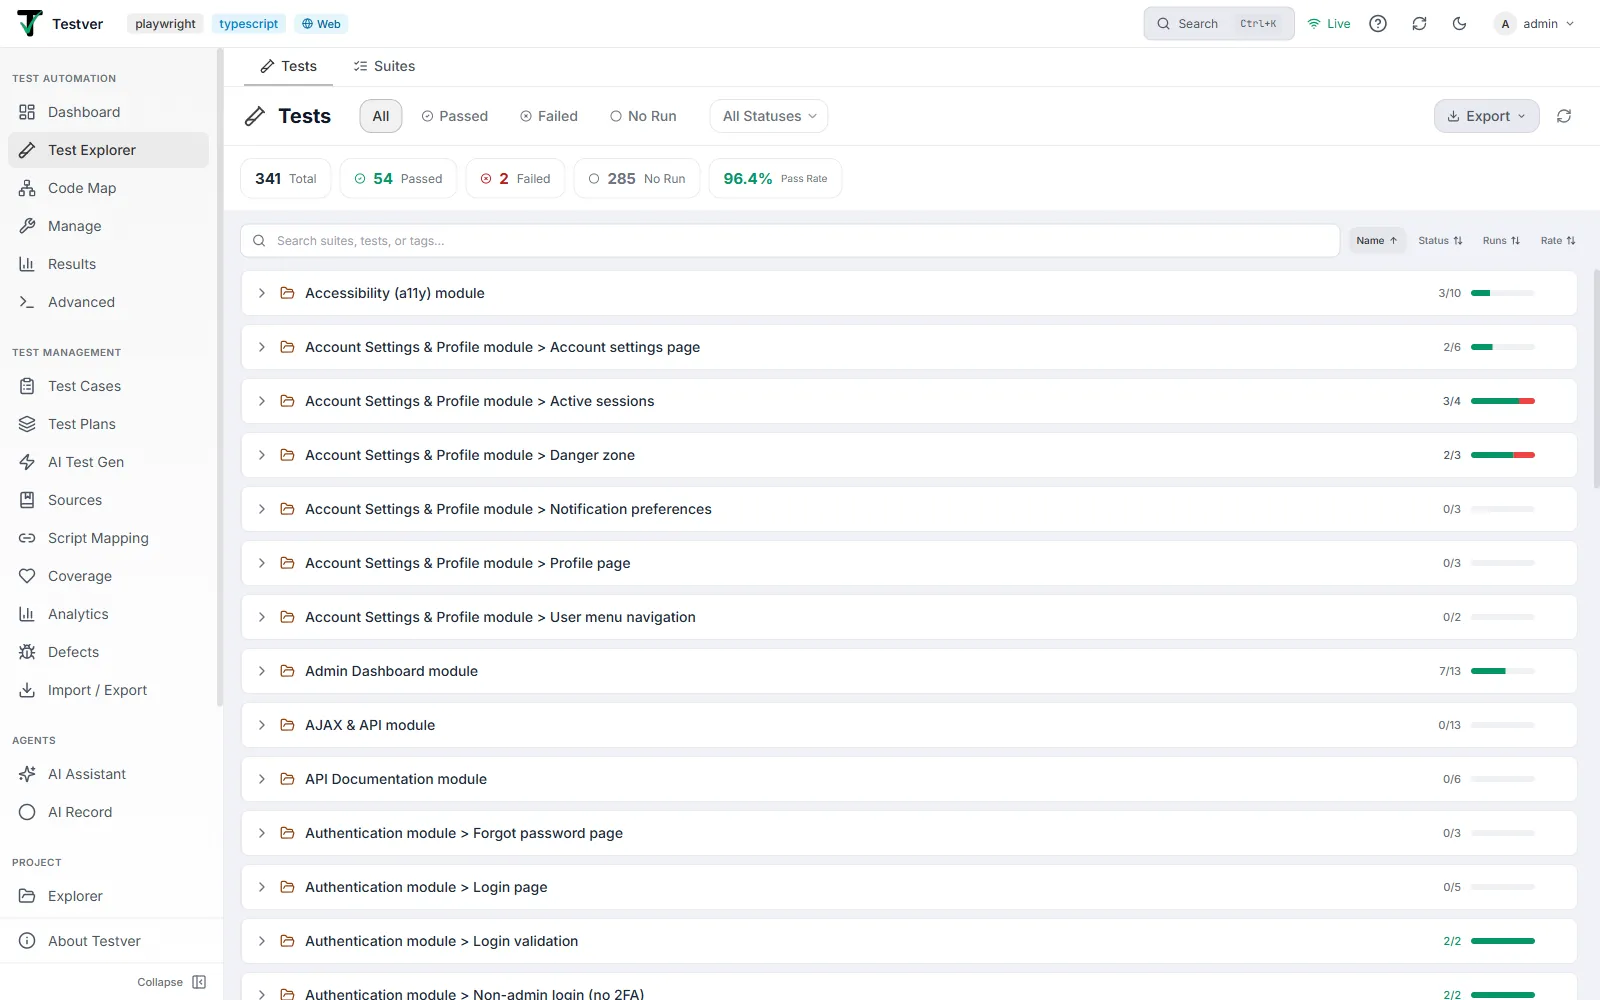
The Tests tab is where the Test Explorer opens. It lists every test Testver discovered by scanning your project, and clicking any one opens its detail view.
The List View
Section titled “The List View”Status filter chips
Section titled “Status filter chips”At the top of the toolbar are four chips that filter the list by the most recent result of each test. Exactly one is active at a time; click another to switch. The active chip is highlighted in its status colour.
| Chip | Icon | Shows | Active colour |
|---|---|---|---|
| All | — | Every test, regardless of status. | Brand (default) |
| Passed | Green check | Only tests whose last run passed. | Emerald |
| Failed | Red X | Only tests whose last run failed. | Red |
| No Run | Empty circle | Only tests that have never been run (run count is zero). | Grey |
Framework filter
Section titled “Framework filter”When your project contains more than one test framework, a Filter funnel icon and a dropdown appear in the toolbar. The dropdown lists All Frameworks plus one entry per detected framework (sorted alphabetically). Pick one to restrict the list to just that framework’s suites.
Script status (lifecycle)
Section titled “Script status (lifecycle)”Separate from the pass/fail result, every test carries a script status describing where it sits in its authoring lifecycle. It shows as a small coloured pill on each row (and in the test’s detail header), and you set it yourself — it never changes from running the test.
| Status | Colour | Typical meaning |
|---|---|---|
| Draft | Blue | Being written / not ready yet. The default for a test with no status set. |
| Active | Green | Complete and in regular use. |
| In Review | Amber | Written, awaiting review or approval. |
| Deprecated | Rose | Being retired — kept for now but no longer maintained. |
- Change one test’s status. Click the pill (it shows a ▾) and pick a status from the menu — on the row or in the detail header. It saves immediately.
- Filter by status. The All Statuses dropdown in the toolbar narrows the list to one status; picking a status auto-expands the matching suites (just like the Passed/Failed/No Run chips).
- Bulk-set. Select several tests with their checkboxes, then use Set status (N) in the top-right actions to apply one status to all of them at once.
The Tags panel
Section titled “The Tags panel”If any test in the project carries tags, a Tags button appears on the right of the toolbar. It shows a count in parentheses when tag filters are active (for example Tags (2)) and turns cyan while it or any tag filter is active.
Click Tags to open the tag cloud beneath the toolbar. It is labelled Filter by tags: and lists every tag found across all tests, each with its usage count in parentheses, sorted most-used first. Clicking a tag toggles it as a filter; active tags turn cyan and show a small X. A test matches if it has any of the selected tags (OR logic). A Clear all link removes every tag filter at once.
When you close the cloud but still have tags selected, a slim active tag chips row stays visible (a tag icon followed by the selected tags). Each chip can be clicked to remove that one tag, and a Clear link removes them all.
The statistics strip
Section titled “The statistics strip”The strip of pills summarizes the tests currently in view. Crucially, the numbers respect your active filters — when any status, framework, tag, or search filter is on, the stats recompute from only the filtered tests; with no filters they reflect the whole project.
| Stat | Icon / colour | How it is computed |
|---|---|---|
| Total | Plain | Count of all tests in the current (filtered) view. |
| Passed | Green check | Tests whose last status is passed. |
| Failed | Red X | Tests whose last status is failed. |
| No Run | Grey circle | Tests with a run count of zero. |
| Pass Rate | Colour-graded | Passed divided by tested tests (Total minus No Run), as a percentage to one decimal. Green at 90%+, amber at 70–89%, red below 70%, and a dash - when there are no tests. |
Search and sort
Section titled “Search and sort”Just above the suite list sits a Search box (placeholder Search suites, tests, or tags…). It filters live as you type and matches against the test name, the suite name, and the test’s tags. A small X clears it. Searching auto-expands all matching suites.
Next to the search box are four sort buttons. Click one to sort by that field; click the same button again to flip between ascending and descending. The active sort button is highlighted and shows an up or down arrow (an inactive button shows a faint up-down icon). Sorting reorders both the suites and the tests within them.
| Button | Sorts by |
|---|---|
| Name | Alphabetical by test/suite name (the default). |
| Status | By last result, ordered failed first, then passed, then skipped, then no-run. |
| Runs | By how many times the test has run (suites by total runs). |
| Rate | By pass rate. Tests/suites with no runs sort to the bottom. |
Multi-select and bulk run
Section titled “Multi-select and bulk run”Each test row has a checkbox (visible on hover, or filled when selected). Tick one or more tests to enter multi-select mode. A slim selection bar appears under the search row showing N selected, Select All, and Deselect All; and two bulk actions appear in the top-right toolbar: Set status (N) and Run Selected (N).
| Control | Location | What it does |
|---|---|---|
| Select All (N) | Selection bar | Selects every test currently passing the filters (N is that count). |
| Deselect All | Selection bar | Clears the entire selection. |
| Set status (N) | Top-right actions | Applies one script status (Draft / Active / In Review / Deprecated) to every selected test at once. |
| Run Selected (N) | Top-right actions | Builds a single framework-appropriate command that targets exactly the checked tests and runs them together. After launching, the selection is cleared. |
Run Selected groups the chosen tests by framework, picks the largest group, and emits the right command for it — for example npx playwright test -g "...", npx jest -t "...", pytest "file::name", mvn test -Dtest="Suite#test", dotnet test --filter "...", robot --test "...", and so on. Test names are escaped where the framework treats the filter as a regex.
Export (CSV / Excel)
Section titled “Export (CSV / Excel)”The Export button (download icon, with a chevron) opens a small menu offering CSV and Excel, each labelled with the number of tests that will be exported. If you have tests selected, a header reads N selected and the export is limited to your selection; otherwise it exports everything currently passing the filters. Files are named testver-tests-YYYY-MM-DD with the matching extension.
The CSV export is a single flat table. The Excel export is a workbook with three sheets: a Tests sheet (the same columns as CSV), a Summary sheet (Total Tests, Passed, Failed, No Run, Pass Rate, Frameworks — all computed from just the exported tests), and a Tags sheet (each tag with its test count, present only if the exported tests carry tags).
| Column (Tests sheet) | Meaning |
|---|---|
| Test Name | The test’s name. |
| Suite | The suite (file/describe) it belongs to. |
| File | The source file path. |
| Framework | The framework it is written for. |
| Status | Last result, or no run. |
| Run Count | Total executions recorded. |
| Pass Count | How many runs passed. |
| Fail Count | How many runs failed. |
| Pass Rate | Pass count / run count as a percentage, or - if never run. |
| Tags | All tags, separated by ; (CSV) or , (Excel). |
| Description | The test’s description, if any. |
| Modifiers | Any modifiers (skip/only/todo/fixme/slow), joined. |
Suite cards
Section titled “Suite cards”The main area is a stack of suite cards — one per file. Each card is collapsible and carries, from left to right:
| Element | Description |
|---|---|
| Expand chevron | Right-pointing when collapsed, down-pointing when expanded. Click anywhere on the header to toggle. |
| Folder icon | An amber open-folder icon marking the suite. |
| Suite name | The file/suite name (truncated with a hover tooltip showing the full name). |
| Pass/total fraction | For example 7/8 — passed tests over total tests. Green when all pass, grey otherwise. |
| Mini progress bar | A tiny bar split green (passed) and red (failed) proportional to results. |
| Run-suite button | A small Play icon that appears on hover. Clicking it runs every test in the suite file (see Troubleshooting for how this differs from a single-row run). |
Test rows
Section titled “Test rows”Expand a suite to reveal its test rows. Each row is clickable (opening the Detail View) and contains, from left to right:
| Element | Description |
|---|---|
| Checkbox | For multi-select. Hidden until you hover the row, or shown filled (brand-coloured) when ticked. Clicking it toggles selection without opening the detail view. |
| Status icon | Green check (passed), red X (failed), grey minus (skipped), or empty circle (no run). |
| Test name | The test’s name, truncated with a hover tooltip for the full text. |
| Modifier badges | Small coloured badges for any modifiers (see table below). |
| Tag chips | Up to three cyan tag chips; extra tags collapse into a +N indicator. |
| Script status pill | The lifecycle status (Draft / Active / In Review / Deprecated), colour-coded, with a ▾ to change it inline. Aligned into its own column. |
| Owner / modified | The git owner (avatar + name) and how long ago the test was last modified — or an uncommitted marker. Hidden by the privacy switch. |
| Run history dots | A small row of up to six dots approximating recent results (green = pass, red = fail). Hidden when the test has never run. |
| Run count | For example 5x — how many times the test has run. Shown only when there is a last status and at least one run. |
| Run button | A Play icon appearing on hover; clicking it opens the test’s Detail View ready to run (the detail panel handles the actual execution). |
The modifier badges decode as follows:
| Badge | Colour | Meaning |
|---|---|---|
| SKIP | Amber | The test is marked to be skipped (from the skip flag). |
| only | Blue | The test is focused — only it (and other only tests) would run. |
| todo | Purple | A placeholder test marked as not yet implemented. |
| fixme | Red | The test is known-broken and flagged to be fixed. |
| slow | Amber | The test is marked slow (longer timeout / known to be lengthy). |
The Detail View
Section titled “The Detail View”Clicking any test row opens the full-screen Detail View for that test. From top to bottom it has a back bar, a header, run controls, a tab bar, and the active tab’s content.
Back bar
Section titled “Back bar”The top strip holds a Back to Tests link (left arrow) that returns you to the List View, a divider, and then the suite’s name (with a file icon) for context.
The header
Section titled “The header”The header presents the test at a glance:
- A large status tile — green/red/grey background with the matching status icon.
- The test name as the heading.
- The script-status pill (Draft / Active / In Review / Deprecated) — click it to change the status right from the detail view.
- A file:line link (for example
tests/login.spec.ts:42) with an external-link icon. Clicking it opens that exact location in the Project Explorer in a new browser tab. - An Ask AI about this test button in the top-right corner, which hands the test off to the AI Assistant.
- When the test has run: the run count (for example
12 runs) and the pass rate (colour-graded green/amber/red). - A tags / modifiers row repeating SKIP, the modifier badges, and the full set of tag chips.
- The test’s description, shown in italics, if one exists.
Run controls
Section titled “Run controls”If the test has a runnable command, an action row sits below the header:
| Control | Behaviour |
|---|---|
| Run Test | Launches the test. While it runs the button becomes Stop. |
| Stop | Cancels the in-progress run. |
| Command pill | Shows the command Testver will execute, tagged Auto (generated) or Custom (when you have configured a custom single-test command in settings). |
| Copy button | Copies the command to your clipboard (shows a green check briefly on success). |
| Mobile device picker | For mobile/Appium tests only: a local-and-cloud device picker (parity with the Runner). Until you pick a device — and an app, for cloud — Run Test stays disabled with a tooltip explaining what is missing. |
The tabs
Section titled “The tabs”A tab bar exposes six views of the test. The Output tab shows a status badge (a pulsing dot while running, a green check or red X when done), and Mapped TCs shows a count badge when mappings exist.
| Tab | What it shows |
|---|---|
| Steps | The human-readable steps of the test — Cucumber scenario steps (with data tables and Examples), or inferred Action/Assert/Setup steps for code-based tests. |
| Source | The actual test source code in a read-only editor; for Cucumber, the resolved step-definition code for each step. |
| Runs | The execution history of this test, with summary cards, a timeline, source filters, and drill-down into any past run. |
| Output | Live console output and progress of the current/most-recent run, plus post-run failure details. |
| Mapped TCs | Manual test cases mapped to this script (from Script Mapping), with a viewer for each case’s steps. |
| Methods | The framework methods (page objects, helpers, utilities) this test uses, directly or transitively, from the Code Map index. |
Steps tab
Section titled “Steps tab”For Cucumber tests this lists the scenario steps, each numbered and connected, with a colour-coded Given/When/Then/And/But keyword badge and the step text. If a step has a data table it is rendered inline. For Scenario Outlines, an Examples table follows, showing every parameter combination.
For code-based tests, Testver derives a human-readable step list from the source (each step tagged Action, Assert, Comment, or Setup). While it is parsing you see Loading test steps…. If no steps can be inferred, it suggests checking the Source tab instead.
Source tab
Section titled “Source tab”Shows the test’s source code in a read-only Monaco editor with the correct language highlighting and line numbers offset to match the real file. A metadata bar above the code shows the file path, the line range, the framework, and a Go to Definition button that opens the file at that line in the Project Explorer.
For Cucumber tests the Source tab is different: it shows, per scenario step, the matching step-definition code (file:line, the method name, and the source), with a N of M steps resolved counter and a per-step Go to Definition button. Steps whose definition cannot be found show a Step definition not found notice.
Runs tab
Section titled “Runs tab”This is the test’s complete result history. When the test has runs, three summary cards appear at the top: Total Runs, Pass Rate (colour-graded), and Failures. If a last-used browser is recorded, a line notes it.
Below that, Execution History opens with a row of up to twenty coloured timeline dots (green/red/grey). Hovering a dot shows its status and timestamp; clicking a dot opens that run’s full execution detail.
Local / cloud source filters
Section titled “Local / cloud source filters”If this test has run on more than one source, a Filter: row of toggle chips appears — Local plus any cloud grids it ran on (Sauce Labs, BrowserStack, LambdaTest). Chips only appear for sources this test actually used. The filter is multi-select; with nothing selected, all runs are shown.
History entries
Section titled “History entries”Under the dots is a list of runs, 20 per page. Each entry shows the status icon and label, the duration, a Local Device or cloud-provider badge, and browser information. When a single run produced several instances (multi-browser fan-out or a Scenario Outline), the row shows an instance count plus per-browser icons. Each entry is clickable to open the full run detail.
Pagination. When the test has more than 20 runs, a pager appears below the list showing “Showing 1–20 of 26 runs” with Prev / Next buttons and a page indicator. Changing a source filter returns you to the first page.
Dates are relative. Instead of a bare calendar date, each run shows when it happened in plain language:
| Shown | Meaning |
|---|---|
Today (5 mins ago) | Ran earlier today — with just now, N mins ago, or N hrs ago precision. |
Yesterday | Ran the previous day. |
Mon, Aug 1 | Anything older. The year is added when it isn’t the current year. |
Hover any date to see the exact timestamp, down to the second.
Drilling into a run shows a Back to History header (with that run’s status and timestamp) and the full execution detail. If that run produced cloud artifacts, its Cloud Artifacts card offers Video, Logs, and Session — the video opens in an in-app player, the same one the Results screen uses. When a run produced multiple matching instances, a selector row lets you switch between them — labelled Examples: with parameter chips for Cucumber outlines, or Runs: with browser chips otherwise. Helpful messages cover the cases where the test was renamed/removed or the run data is no longer available.
Output tab
Section titled “Output tab”Before any run, this tab is an empty prompt: No test output yet — Run the test to see live output here. When you start a run, the view auto-switches here.
While running, an execution header shows a spinner and Running… with an elapsed-seconds counter, a live progress bar (green/red split), the current test number, running pass/fail tallies, and the name of the test currently executing. Console output streams live below in a terminal-style pane with ANSI colours preserved (stderr lines in red).
When the run finishes, a compact summary line replaces the progress band — colour-tinted by pass rate — showing Run Complete or Run Failed, the elapsed time, total/passed/failed/skipped counts, and the pass rate. It offers View Full Results (jumps to the Results screen for this run) and a Dismiss button.
Below the summary, a Failed Tests panel expands each failure with its screenshot (click to enlarge in the viewer), the error message (with a copy button), a collapsible stack trace, a per-step pass/fail breakdown, and — for Playwright — Download Trace and Open in Trace Viewer links. If there were no failures but screenshots exist, a Screenshots thumbnail strip is shown instead.
Mapped TCs tab
Section titled “Mapped TCs tab”Shows the manual test cases mapped to this script file (created in Script Mapping). If there are none, an empty state explains how to create mappings. Otherwise the mappings are split into Mapped to this test and Other mappings in <file>.
Each mapped case shows its title, ID, a priority badge, a type badge, a sync-status badge (Synced / Case Updated / Script Updated / Script Missing), and an automation-status badge (Automated / Manual). An eye button opens a modal with the case’s preconditions and a Test Steps table (#, Action, Expected Result, Test Data).
Methods tab
Section titled “Methods tab”Lists the framework methods — page objects, helpers, utilities — this test uses, directly or transitively, drawn from the Code Map index. While analyzing it shows Analyzing usage…. If none are found (for example a test using only built-in framework calls, or helpers that cannot be resolved statically), it says so.
When there are methods, a count line precedes the list, and — if there are more than four — a filter box lets you narrow by method name, class, or file. Each row shows the method name, its class, a role badge, and its file:line, with three actions: open in Project Explorer, open in Code Map · Inventory, and copy the method name.
Related
Section titled “Related”- Test Explorer overview — the screen and its two tabs.
- Suites tab — group tests and run them together.
- Results — the full history of every run.