

Dashboard tab
The Dashboard tab of the CI/CD Pipelines screen (/pipelines?tab=dashboard) answers the question “is CI healthy?” — and lets you click straight through to whatever looks wrong.
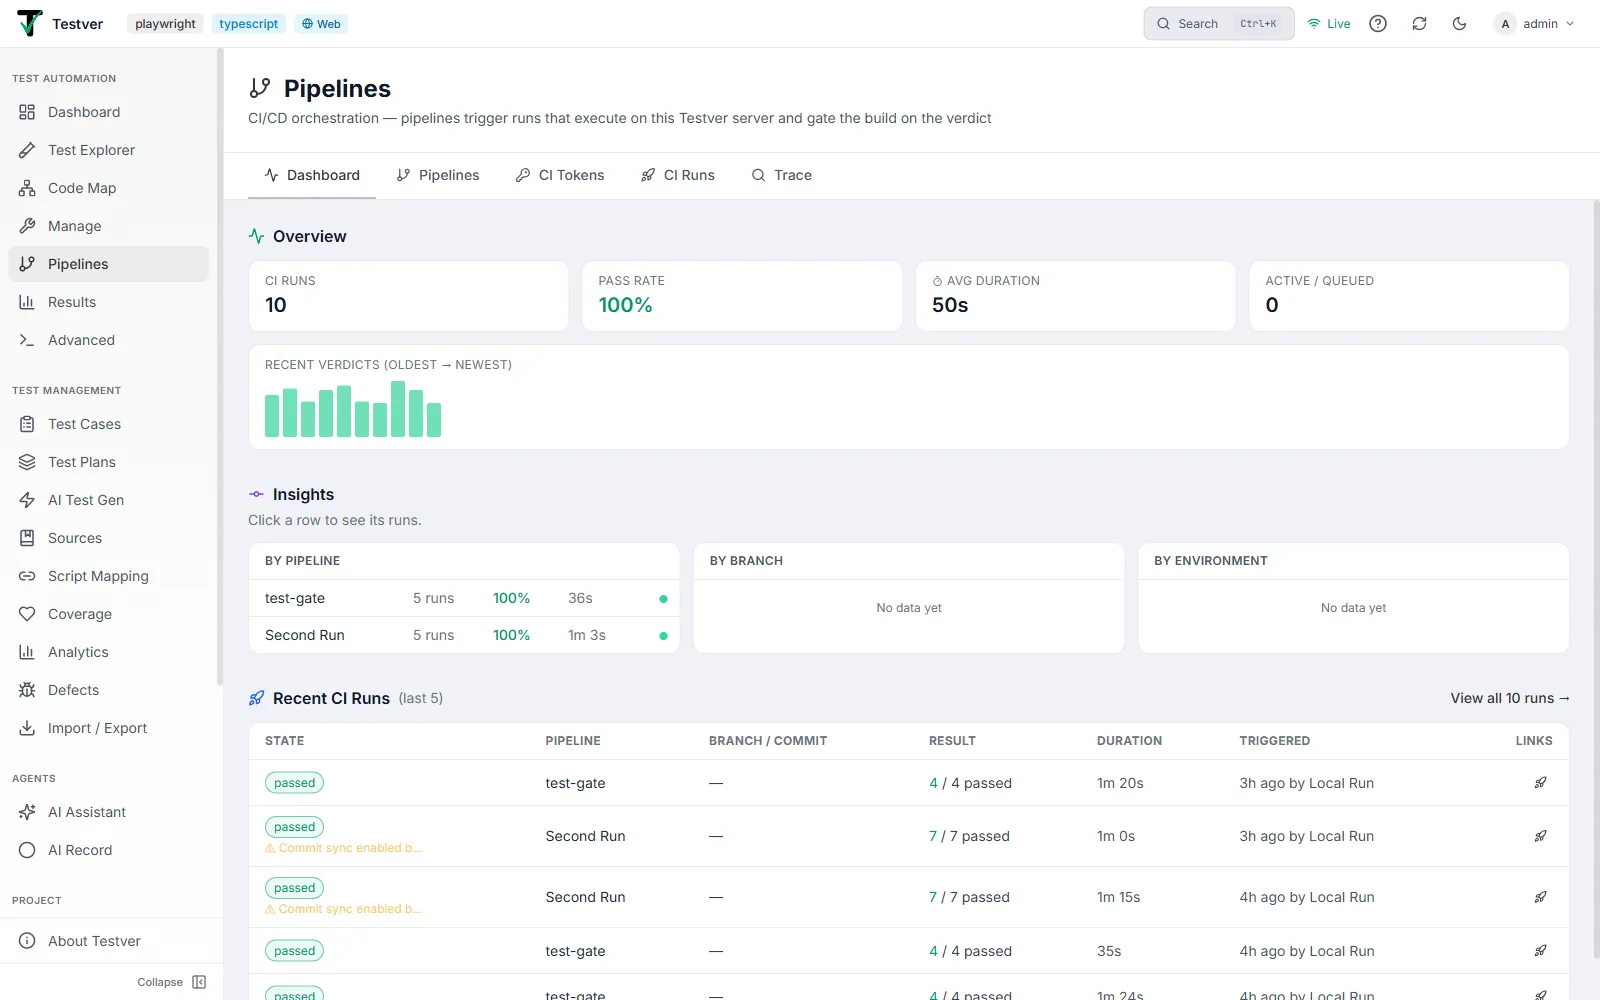
Overview KPIs
Section titled “Overview KPIs”Four cards summarise every CI-triggered run the server has recorded:
| Card | What it shows |
|---|---|
| CI Runs | Total number of CI runs recorded. |
| Pass Rate | Percentage of finished runs that passed. Green at 90%+, amber from 70%, red below. |
| Avg Duration | Average execution time of the runs themselves — queue waiting time is excluded, so this reflects how long your tests actually take. |
| Active / Queued | How many runs are executing or waiting right now. Non-zero means CI is busy this moment. |
Recent verdicts
Section titled “Recent verdicts”A strip of bars, oldest on the left, newest on the right — the shape of your CI health over time. Each bar is one finished run: green for passed, red for failed, with the bar’s height reflecting how long the run took relative to the others. A wall of green with one red spike tells a very different story from alternating colours, which usually means flakiness.
Hovering a bar opens a detail card with the pipeline name, verdict, branch, result counts, duration, and when it ran. Clicking a bar opens that run’s full report in Results.
Insights
Section titled “Insights”Three tables break the same runs down by dimension:
| Table | Answers |
|---|---|
| By Pipeline | Which pipelines are reliable, and which are slow or failing. |
| By Branch | Whether failures are isolated to one feature branch or affect main. |
| By Environment | Whether a specific environment (staging, QA, pre-prod) is dragging results down. |
Each row shows the number of runs, the pass rate, the average duration, and a dot for the most recent state — green for passed, red for failed, and a pulsing blue dot when something is running right now.
An environment only appears here once a run has actually executed with it — runs that used the target’s default environment are grouped under that default, and rows are ordered with the most recently active first.
Recent CI Runs
Section titled “Recent CI Runs”The last five runs, using the same table as the CI Runs tab. It’s a glance, not a history — View all runs → in the corner opens the full, filterable list.
Before your first run
Section titled “Before your first run”Until at least one CI run exists, the Dashboard shows a short setup prompt with a Set up a Pipeline → button that takes you to the Pipelines tab. Every panel on this page fills in automatically from the first trigger onward — there is nothing to configure here.
Related
Section titled “Related”- CI/CD Pipelines overview — the concept and how the pieces fit together.
- CI Runs tab — the full run history behind these summaries.
- Pipelines tab — create the mappings this data comes from.
- Results — the full report for any run shown here.