

AI Assistant
Introduction
Section titled “Introduction”What is the AI Assistant?
Section titled “What is the AI Assistant?”The AI Assistant is Testver’s built-in chat agent. You open it from the sidebar (AI Assistant, the sparkles icon) or at the URL /ai, type a request in plain English, and the assistant works on your test-automation project the way a teammate would: it reads your files, writes and edits test scripts, runs your test suite, sends API requests, and can even open a real browser or a cloud mobile device and click through your app while you watch.
Unlike a generic chatbot, the assistant is grounded in your actual project. It can see your folder structure, your existing tests, page objects, configs, and the results of your latest runs. When it suggests a fix, it can apply that fix directly to the file on disk (after you approve), then re-run the test to prove it worked.
Who this guide is for
Section titled “Who this guide is for”This guide is for anyone who uses the AI Assistant screen, whatever your level:
- QA engineers and testers who want to write, fix, or refactor test scripts faster.
- Developers who need to understand an unfamiliar test suite or debug failing tests.
- API testers who want to generate, validate, and chain API requests by describing them.
- Test leads and managers who want quick summaries, flaky-test reports, and dashboards from existing run data.
- Newcomers to Testver who want a guided, plain-English way to get things done without learning every menu first. No coding is strictly required to use the assistant, you talk to it in plain English, but it helps to understand what it is doing on your behalf, which is what this guide explains.
Key terms
Section titled “Key terms”A few words appear throughout this guide and on screen. Here is what each one means in the context of the AI Assistant.
| Term | What it means here |
|---|---|
| Agent | The AI itself. Not just a text generator, it takes actions (reads files, runs tests, clicks in a browser) to complete your request, step by step. |
| Tool call | A single concrete action the agent takes, such as reading a file, editing a file, running a command, sending an API request, or clicking in the browser. Calls made in a row are gathered into one collapsible row that says what they did (“Read 7 files, edited LoginPage.ts”). |
| Permission | A consent prompt. Before the agent does anything that changes your machine or sends live traffic, it shows a Permission required card and waits for you to choose Allow, Always allow, or Deny. |
| Mode | Which kind of work this chat is focused on: Web (test scripts), API (endpoints and chains), Mobile (iOS/Android devices), Reporting (analytics and dashboards), or Ask (questions about the application you are testing). The mode decides which tools and instructions the agent is given. |
| Model / Provider | The underlying AI brain. A provider is the service supplying it — Testver (managed cloud) or a local server (Ollama, LM Studio). A model is the specific brain from that provider; with Testver it is chosen for you. You pick these from the model selector near the Send button. |
| Live preview | The split panel that appears on the right when the agent opens a browser (web mode) or a cloud phone (mobile mode), so you can watch what it is doing in real time, and optionally take control yourself. |
| Session | One saved conversation, kept in the history sidebar. A session remembers its messages, the agent’s tool calls and file edits, and the mode it was in. You can rename, pin, search, reopen, or delete sessions. |
How it works
Section titled “How it works”Every request follows the same simple loop:
- You type a message and press Send (or Enter).
- The assistant streams back its thinking as text, in real time.
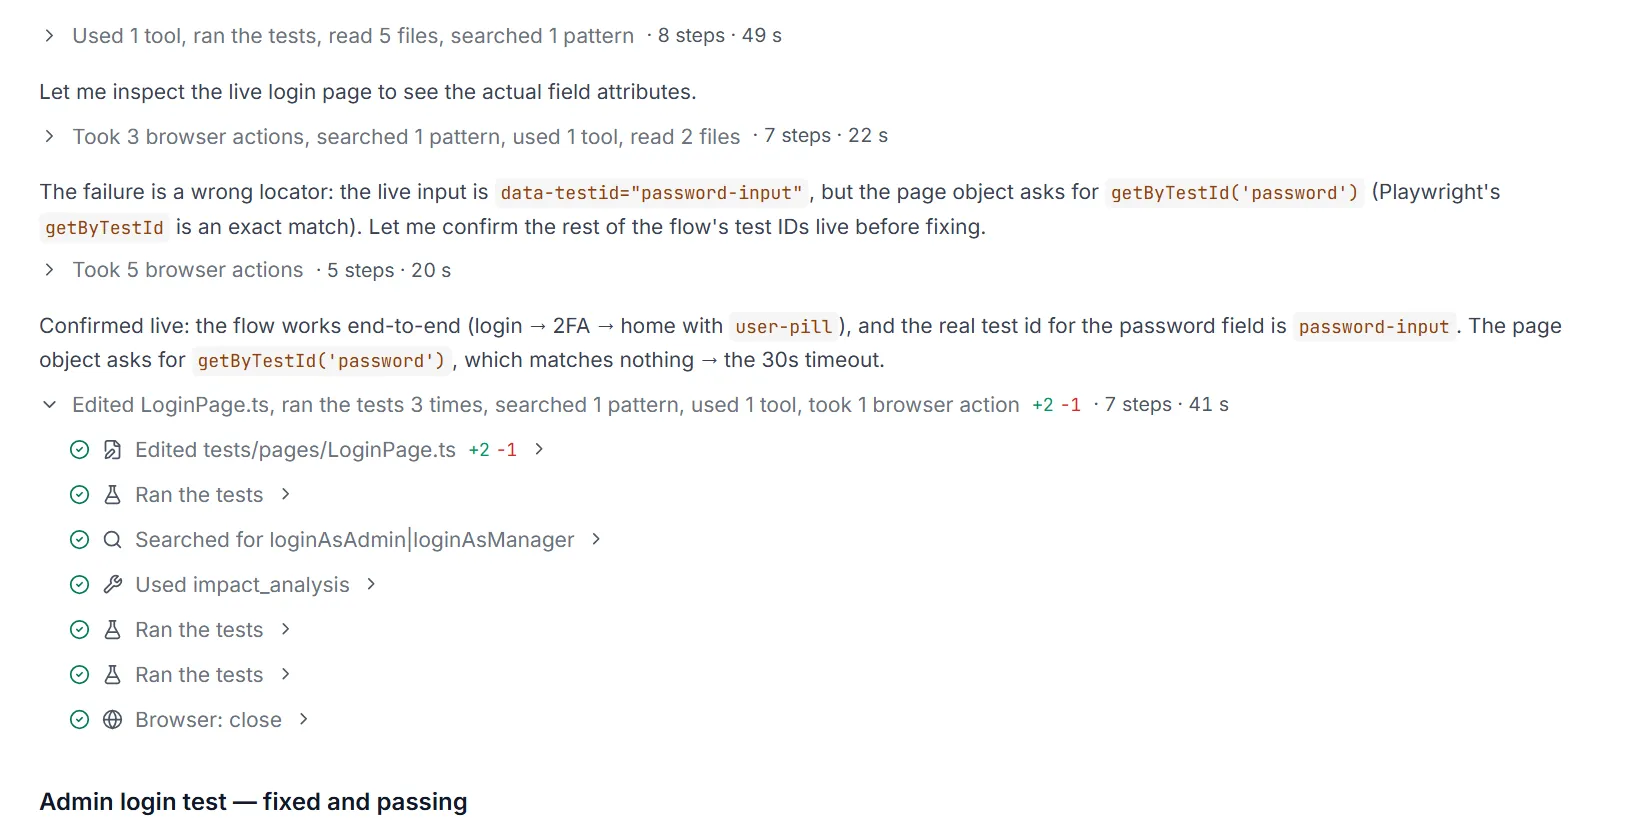
- When it needs to act, it makes tool calls. Calls made in a row are gathered into one row that says what is happening (“Editing pages/LoginPage.ts”) and, when done, sums it up (“Read 7 files, edited LoginPage.ts”). Click it to see every call.
- If that action changes files or sends live traffic, it first shows a Permission required card; nothing happens until you choose.
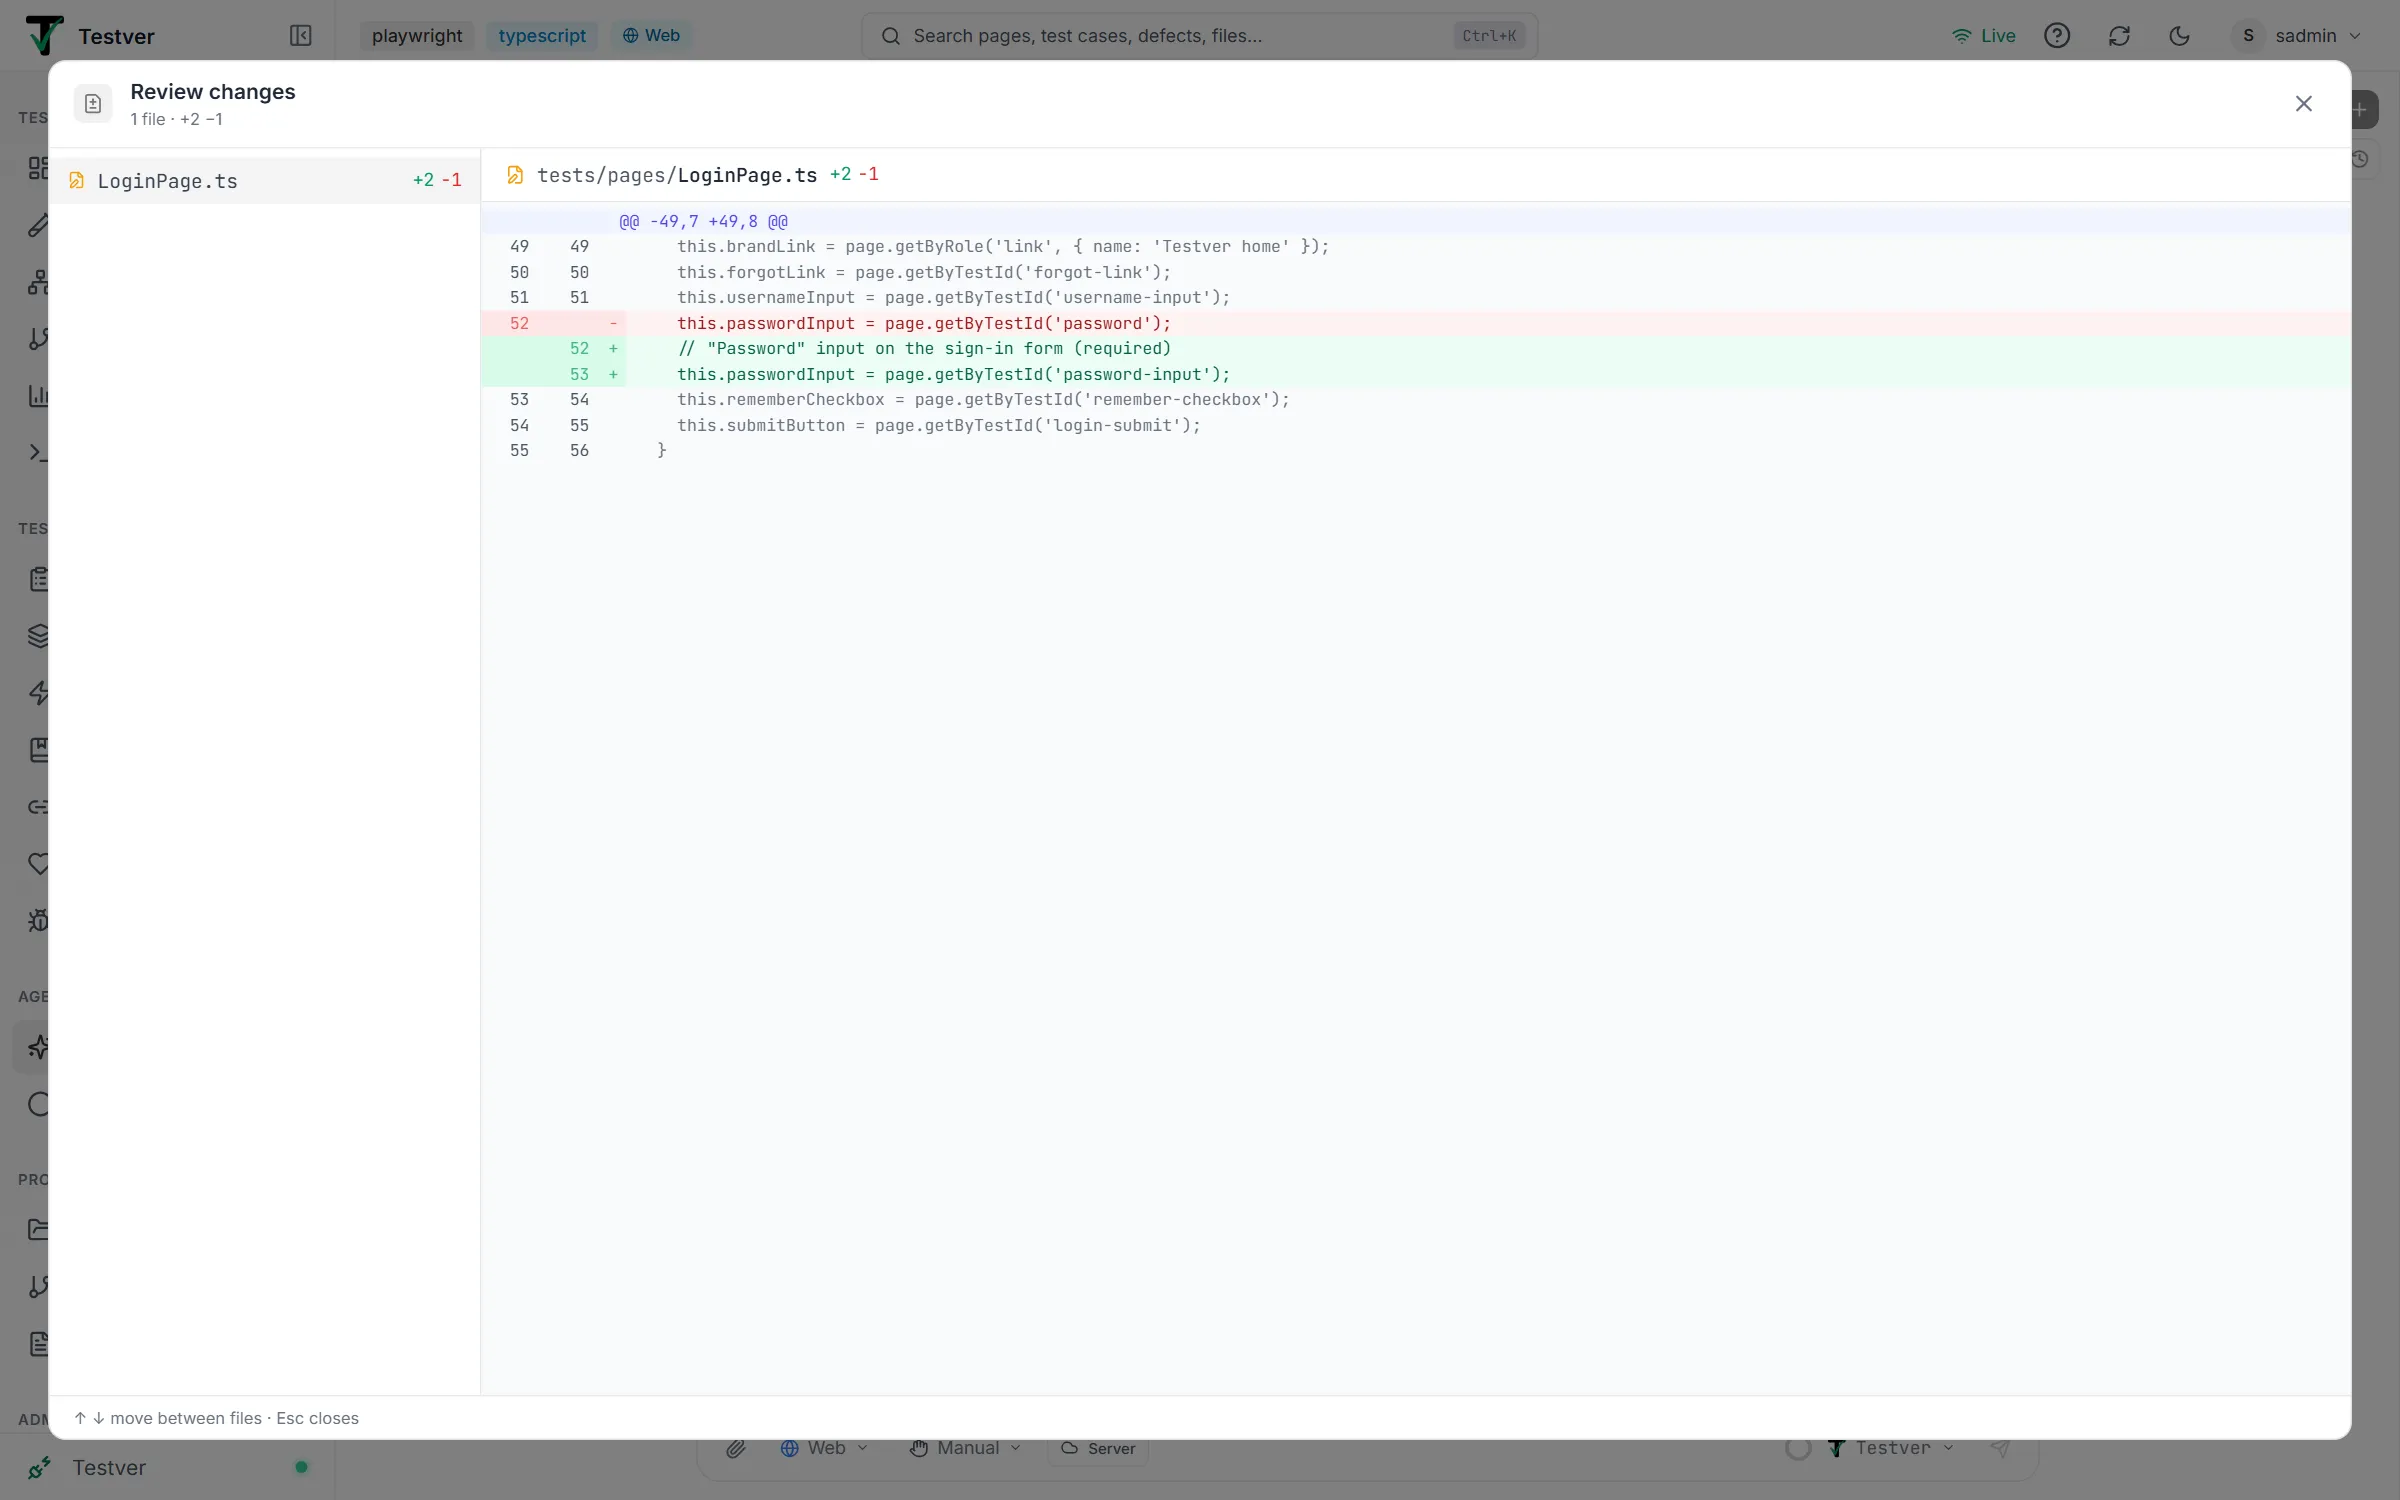
- Each file edit opens to a colour-coded diff (lines added in green, removed in red), and a request that changed files ends with a Changed N files card you can review file by file.
- The agent keeps reading, editing, and running as needed, then finishes with a written summary of what it did.
- The whole conversation, text, tool calls, diffs, and errors, is saved as a session you can reopen later.
Getting Started
Section titled “Getting Started”Opening the AI Assistant
Section titled “Opening the AI Assistant”- In the left sidebar, click AI Assistant (the sparkles icon). The browser navigates to
/ai. - Alternatively, open the command palette and choose AI Assistant, or click the AI Assistant card on the dashboard.
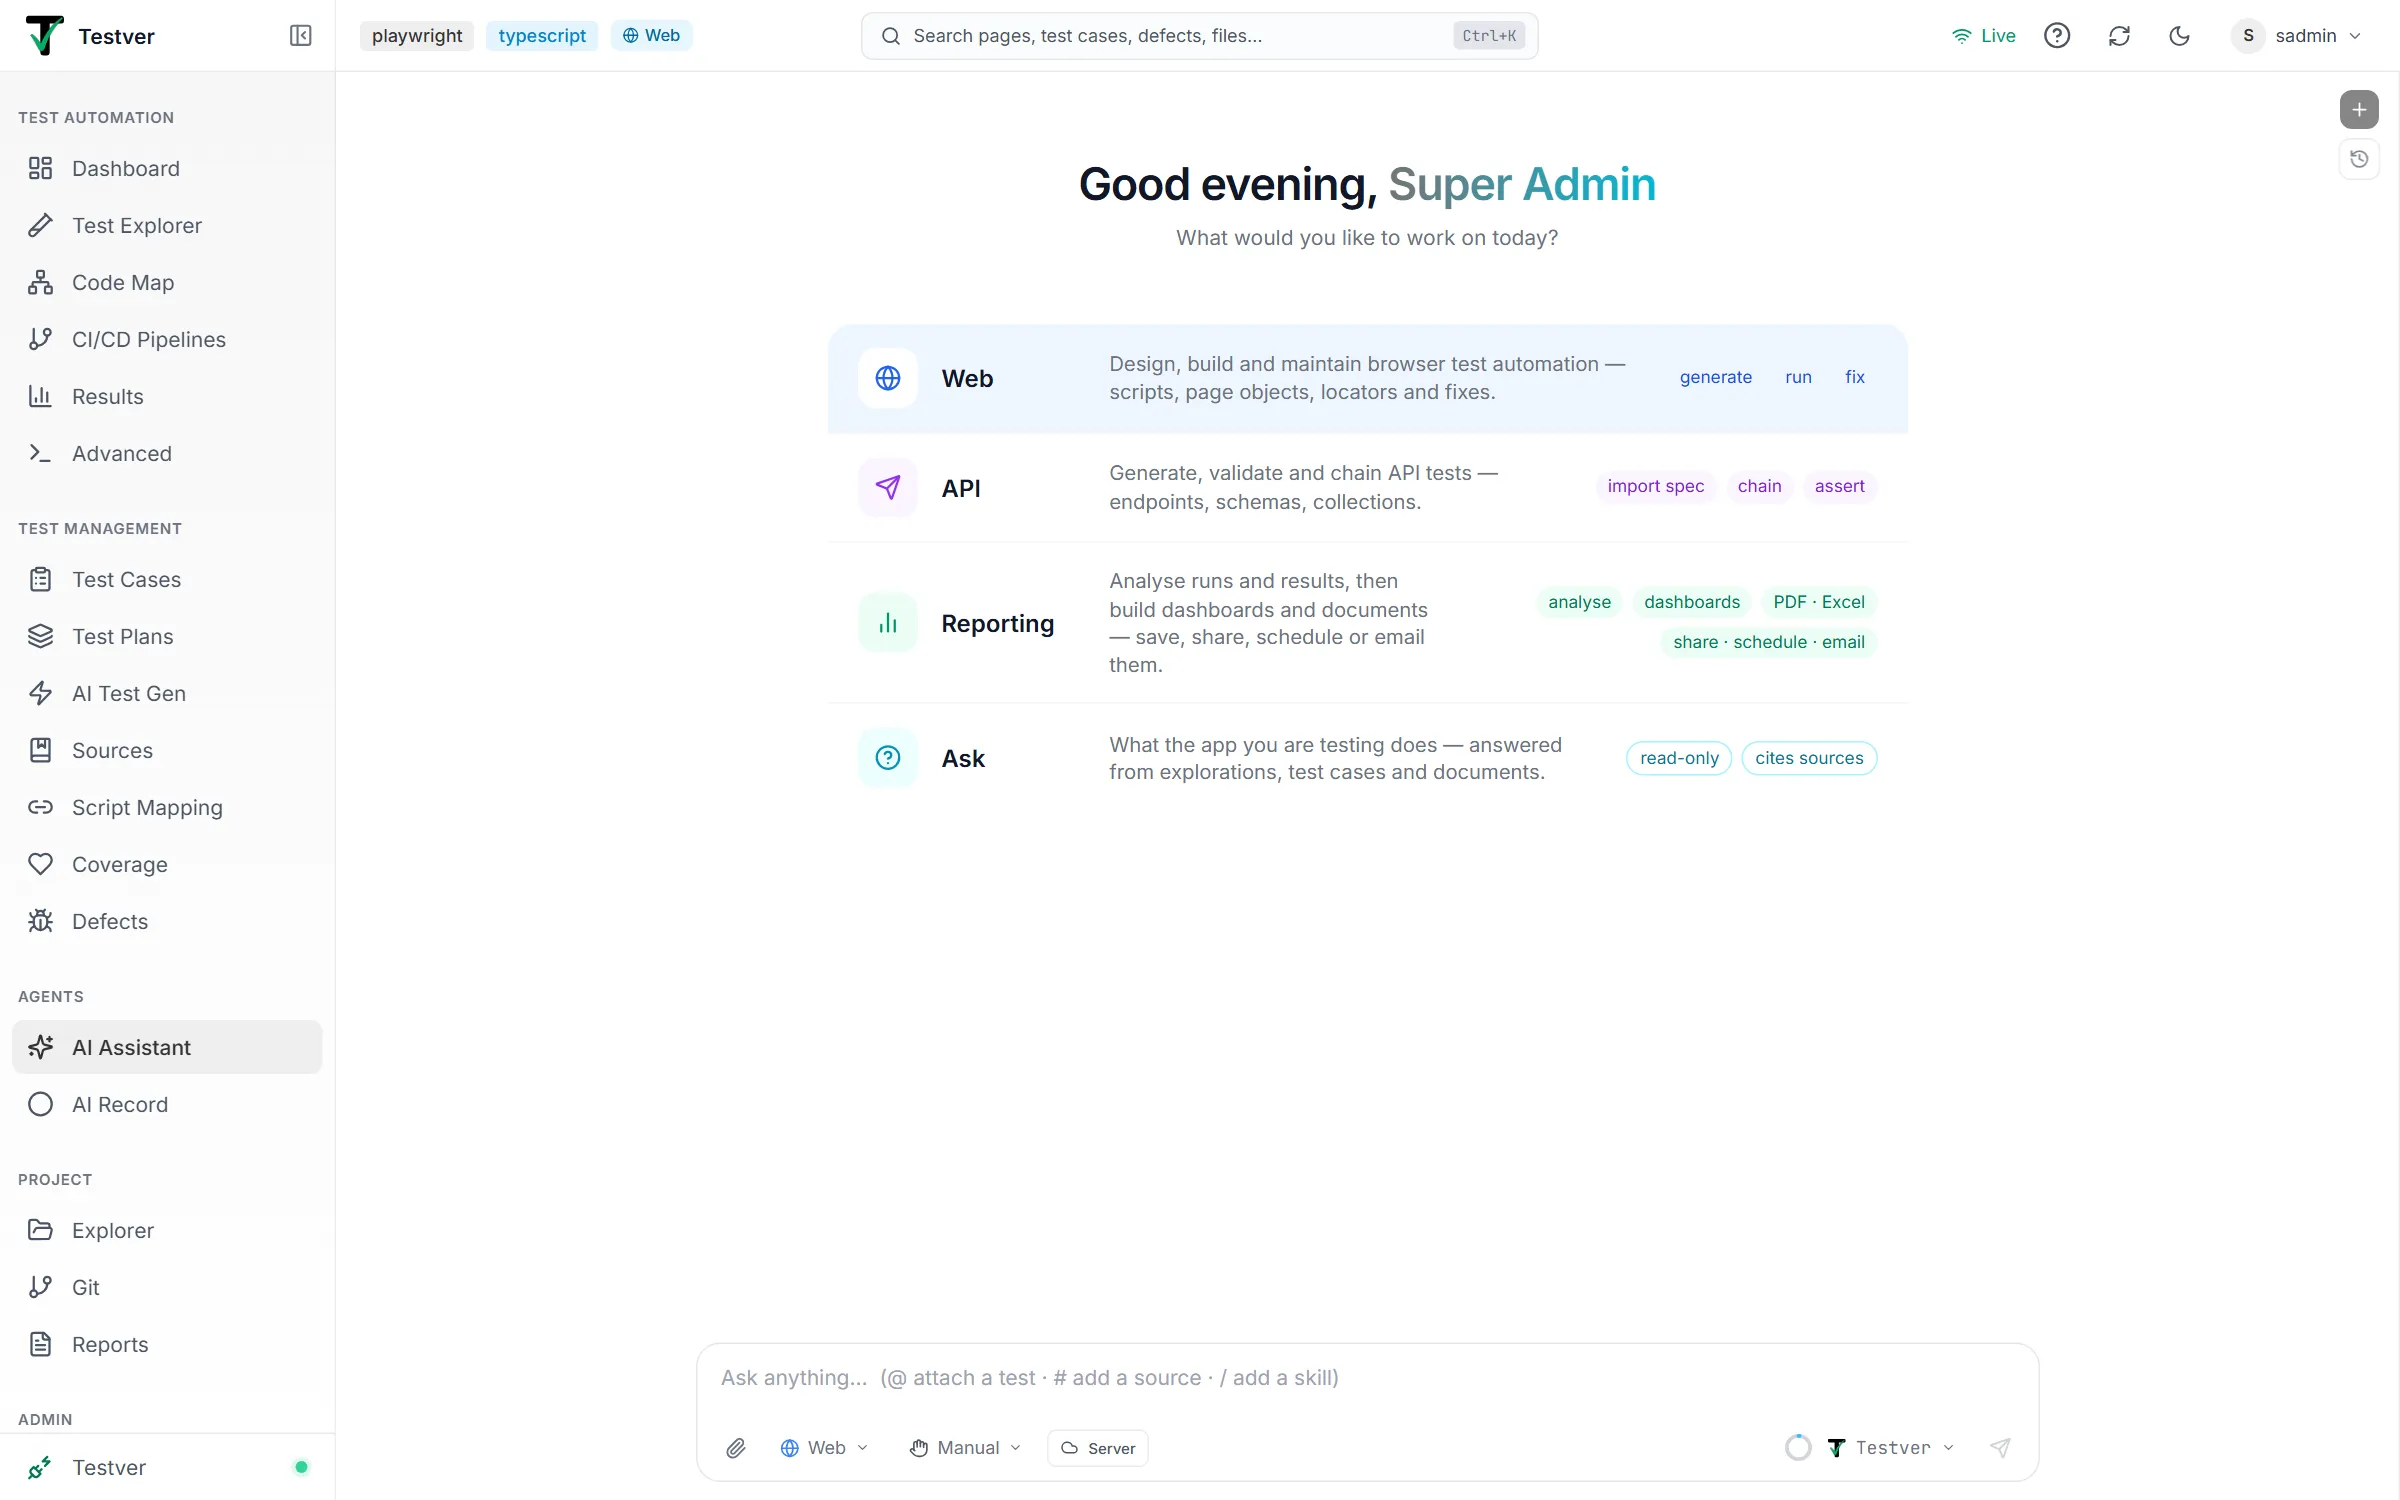
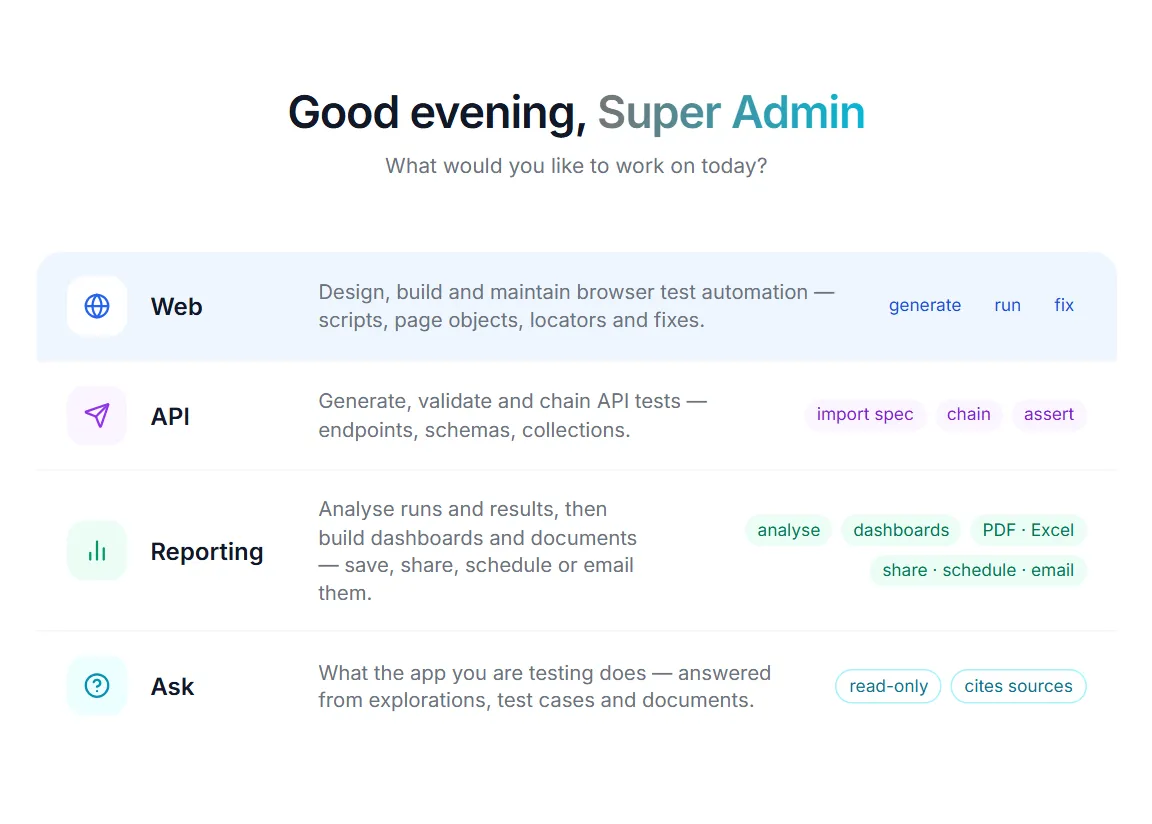
- The home screen greets you by name with a time-of-day greeting (“Good morning / afternoon / evening”) and asks “What would you like to work on today?”.
- Below the greeting, one row per mode shows what it is for and chips for what it can do. Click a row to switch to that mode; the message box is focused, ready to type.
- Or choose your Mode (Web or Mobile, API, Reporting, Ask) from the dropdown in the composer toolbar, type your request, and press Enter to begin.
The screen layout
Section titled “The screen layout”The AI Assistant is a focused, full-height chat screen. Its parts are:
| Area | Where | What it does |
|---|---|---|
| Welcome / Timeline | Centre | Before you send anything you see the welcome screen: a greeting and one row per mode, each with its description and what it can do. Click a row to switch to that mode. After your first message it becomes the conversation timeline: your messages, the AI’s replies, tool calls, and file diffs. |
| Composer | Bottom centre | The message box plus its toolbar: attach files, pick mode, see where browser actions run, pick the model, and send (or stop). |
| Floating controls | Top-right | Two small buttons: + (New Session) and the History (clock) icon to show or hide the session sidebar. |
| History sidebar | Right edge | Slides in when you click the History icon. Search box, mode filter chips, and your saved sessions grouped by Pinned / Today / Yesterday / This Week / Older. |
| Live preview panel | Right split | Appears only when the agent opens a browser (web) or a cloud device (mobile). Shows a live mirror you can watch and control. Resizable, and (for web) detachable as a floating Picture-in-Picture. |
| Permission card | Above composer | A floating Permission required card appears just above the message box whenever the agent asks to run a tool that changes things. |
At a glance
Section titled “At a glance”- Send with the paper-plane button or Enter; use Shift+Enter for a new line. The box grows as you type (up to a limit) and resets after sending.
- While the AI is working, the Send button becomes a Stop (square) button, press it to halt generation immediately.
- Attach files or Sources with the paperclip: PDF and Word documents, spreadsheets and CSV, text and config files, and code or test files. (Not images or PowerPoint — see Attaching files.) Reporting mode takes uploaded files (a results file to report on) but not Sources.
- The mode you pick is remembered for next time and is saved per session.
- A small badge near the mode picker tells you whether browser actions will run on the Server or on your Local machine.
- Everything you do is saved as a session, reopen it any time from the History sidebar.
The Composer (Talking to the Agent)
Section titled “The Composer (Talking to the Agent)”The message box
Section titled “The message box”The composer at the bottom is where you talk to the agent. The placeholder lists the shortcuts the current mode offers — in Web, Mobile and API mode “Ask anything… (@ attach a test · # add a source · / add a skill)”; Reporting offers @ for a test and / for skills, and Ask only # for sources. Type naturally, full sentences work better than keywords. The box auto-grows as you add lines (up to a maximum height, after which it scrolls), and snaps back to a single line once you send.

- Enter sends the message.
- Shift+Enter inserts a new line without sending, useful for multi-line or multi-step requests.
- While the agent is streaming a response, the box is disabled, you cannot send a second message until the current one finishes or you stop it.
Toolbar controls
Section titled “Toolbar controls”To the right of the toolbar:
| Button | When shown | What it does |
|---|---|---|
| Send (paper plane) | When idle | Sends your message. Disabled (greyed) until you type something. |
| Stop (square) | While the AI is working | Immediately halts generation and any in-progress tool execution. A “Generation stopped by user” marker appears in the timeline, and any pending permission prompts are dismissed. |
Attaching a test with @
Section titled “Attaching a test with @”Type @ in the message box to attach a single test to the conversation. A list of every test Testver has discovered appears; keep typing to narrow it by name or file, and pick one. The attached test shows as a chip above the box, with an x to remove it.
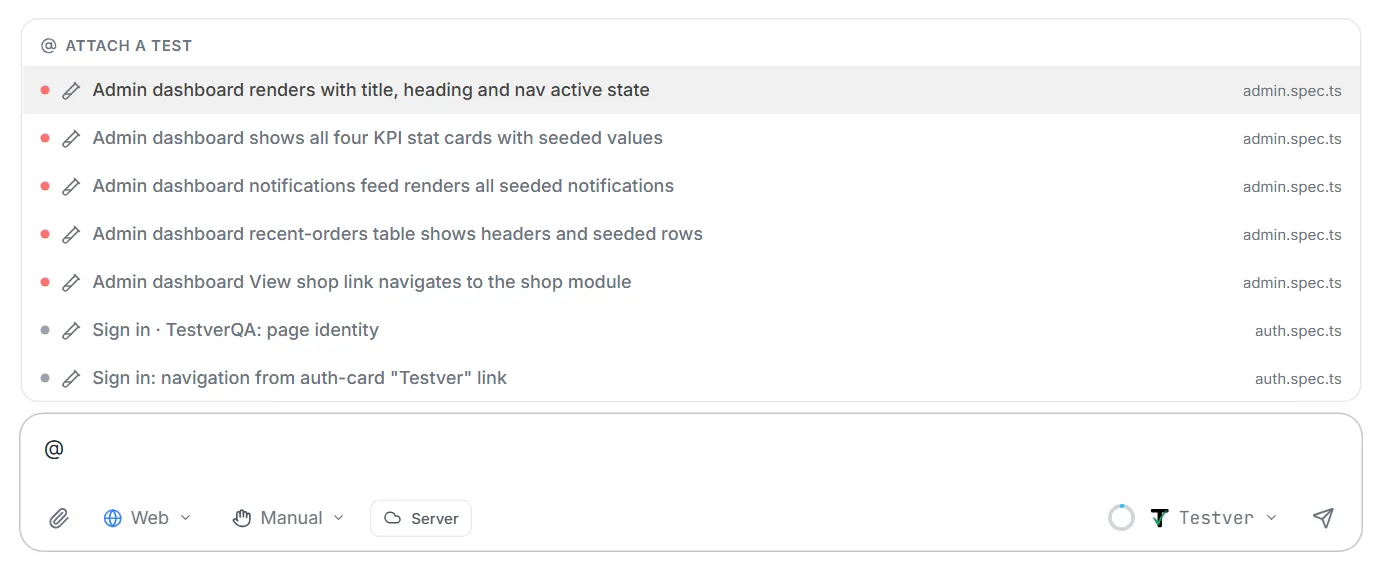
Attaching a test does two things:
- It scopes the agent to that test. The test’s identity, its recent run history, its own source and its run command — the same command Test Explorer’s Run button uses, your Run Commands template included — are put in front of the agent, with an instruction to work on that test and nothing else. Asked to run it, the agent runs it straight away instead of reading your config to work out a command.
- It chooses the right tools, from the test’s framework rather than from the mode you happen to be in. Attach an Appium test while in Web mode and the agent is given the mobile toolset and mobile guidance, because that is what the test needs. Where the framework does not settle it — a plain jest or pytest test can drive a browser in one project and an API in another — it keeps the mode you are working in.
Available in Web, Mobile and API modes — the modes that can read, edit and run a test — and in Reporting, where an attached test is something to report on: its run history, failures and flakiness, looked up by name. Reporting keeps its own read-only tools whatever the test’s framework. Ask has no file access, so the control does not appear there.
Adding skills with /
Section titled “Adding skills with /”Skills are written instructions — your framework conventions, or a whole procedure such as Explore & Automate — that the agent follows when you pick them. Type / as the first character in the message box: an Add a skill list opens with every skill enabled in Settings → Skills, each with its description and a Built-in or Custom label.
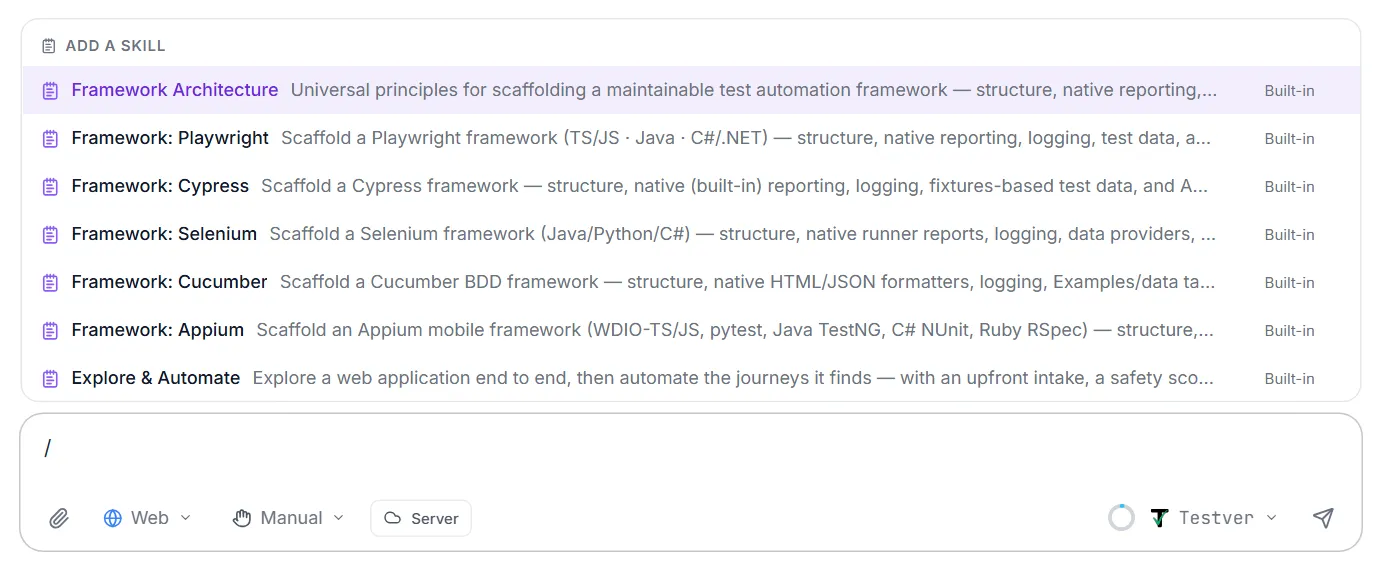
- Keep typing to narrow the list by name, slug or tag; pick with a click, or with ↑ ↓ and Enter or Tab. Esc closes it.
- Each picked skill shows as a violet chip above the box, with an x to remove it. Picking it again in the list removes it too.
- Manage skills… at the bottom of the list opens Settings → Skills. If no skill is enabled yet, the list says so.
- A
/anywhere but at the start of the message types through untouched.
The picked skills go with that one message: your message in the conversation ends with a 📚 Skills used: line naming them, and the chips then clear. Pick a skill again for a follow-up that still needs it. Skills work in Web, Mobile, API and Reporting mode; Ask takes none.
Finding and running tests by name
Section titled “Finding and running tests by name”In Web, Mobile and API mode the agent knows your automation library — the tests Test Explorer lists — without searching your spec files for them. Questions like “which tests cover checkout?”, “what is failing?”, “is there a test for password reset?” or “what does the admin login test do?” are answered from it: each test’s file, tags, steps, the page-object methods it calls, its linked test case, its run command and its run history (flaky, failing since, last passed, getting slower, a browser or local / cloud pattern). The history is the one on the test’s Runs tab.
To run a test, the agent names it — “run the admin login test” — and Testver builds the exact command Test Explorer’s Run button uses, your Run Commands template included. A test the agent has just written is found too. It works the same on Windows, macOS and Linux.
For “which tests would a change affect?” the agent uses the Code Map: every test that uses a method, page object, class or file, however it reaches it.
Attaching Sources
Section titled “Attaching Sources”Documents you already keep in Sources — Requirements, Notes, JIRA stories and Other Sources — can go with a message without uploading anything again.
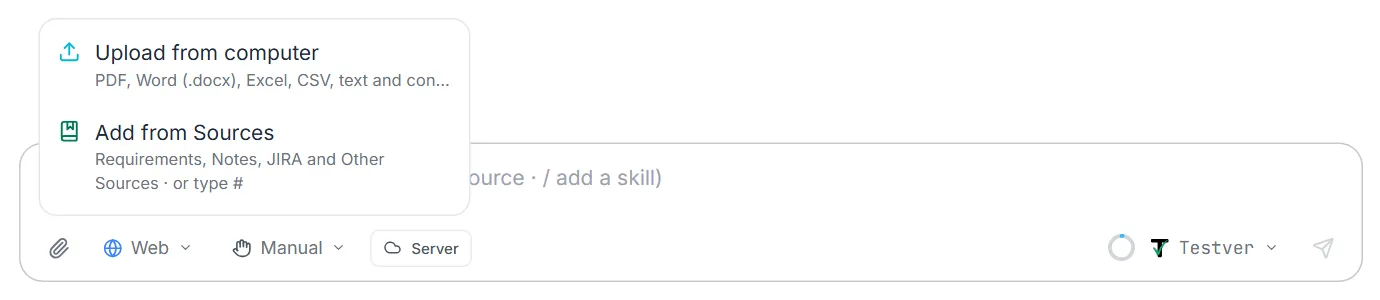
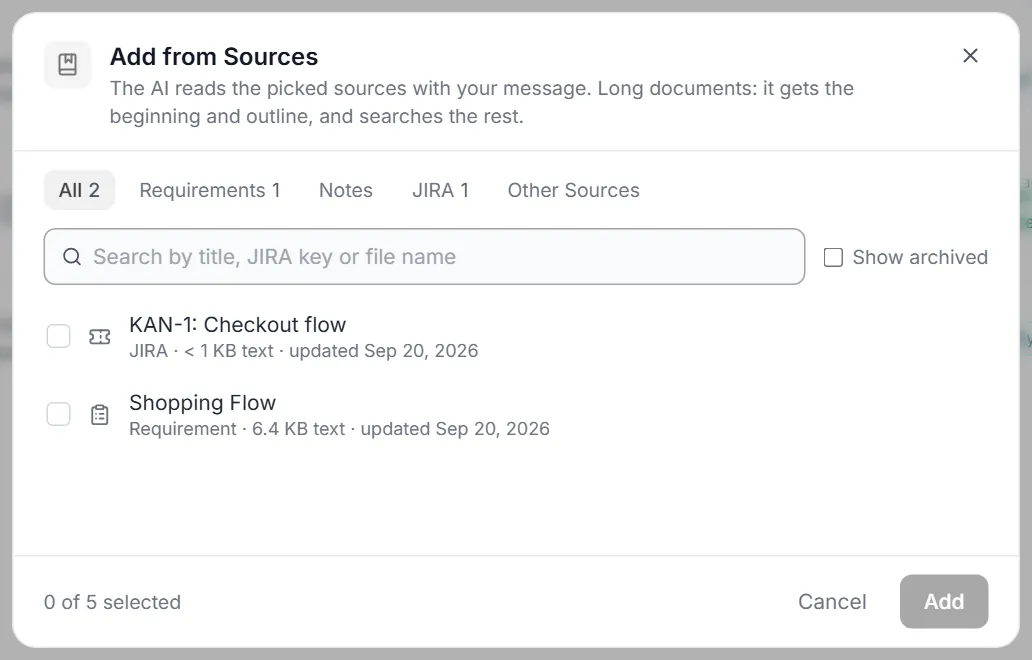
- Click the paperclip → Add from Sources. Pick from the tabs (or search by title, JIRA key or file name); Show archived lists archived ones too. Up to 5 per message.
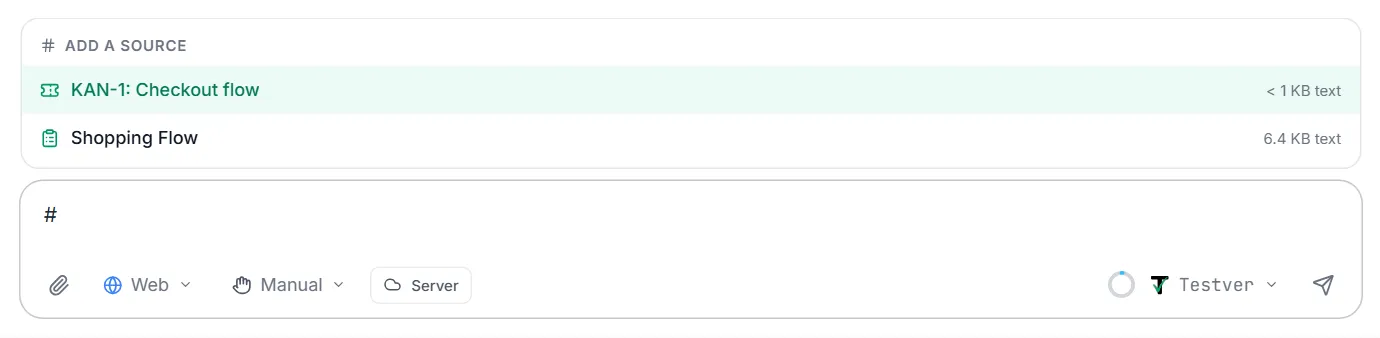
- Or type # in the message box: matching sources appear as you type, and Enter adds the highlighted one. The list only opens when something matches, so
#123in a sentence types through untouched.
Picked sources show as green chips above the box, with an x to remove one. They go with that one message; the transcript names them with their ids (for example Checkout PRD (SRC-1)), so a follow-up like “now write the negative cases” can read the same document again.
What the agent gets:
| Source | What the agent reads |
|---|---|
| Short (most Notes, JIRA stories, typical requirements) | The whole text. |
| Long document | Its beginning and its outline (headings), plus an instruction to search that document for the sections it needs — nothing is cut off silently, and the conversation is not flooded. |
| Image only (a screenshot under Other Sources) | A note that it has no readable text — the picker marks it no readable text too. |
| A document registered by project path | Read from the file on disk, so edits are picked up. |
Sources are read fresh when you send, not when you pick them. Test cases the agent creates from an attached source are linked to it, so they appear on the Sources screen and count in its coverage.
In Ask mode the paperclip opens Answer from Sources directly: the answer comes only from the sources you pick, still with citations. If they do not cover the question, Ask says so instead of answering from anything else.
Reporting mode takes no Sources (it works from your runs and results, so # is not offered there, and Sources attached in another mode are removed when you switch). It does take uploaded files: the paperclip opens the file picker directly, and drag-and-drop works — so a JUnit XML or a CSV of results downloaded from CI can be reported on like your own run history.
Attaching files
Section titled “Attaching files”In Web, Mobile and API mode, click the paperclip → Upload from computer in the toolbar, or drag files straight onto the message area (a “Drop files here to upload” overlay confirms the drop zone). Uploaded files appear as small chips between the text box and the toolbar, each showing a type icon, the file name, and its size, with an x to remove it before sending.
Only file types the assistant can actually read are accepted — the picker filters to them, and a dropped file that is not on the list is refused with a sentence saying why (the rest of the batch still uploads). The text of each file is extracted and placed in the message context; very long files are truncated at about 15,000 characters, and each file may be at most 20 MB.
| Accepted | Extensions |
|---|---|
| Documents | .pdf, .docx |
| Spreadsheets | .xlsx, .xls, .csv (every sheet becomes CSV) |
| Text & data | .txt, .md, .html, .xml, .json, .yaml, .yml, .toml, .ini, .cfg, .properties |
| API descriptions | .har, .proto, .graphql, .gql, .wsdl, .xsd |
| Code & tests | .js, .ts, .jsx, .tsx, .py, .java, .kt, .cs, .rb, .go, .rs, .feature, .gherkin, .robot, .sh, .bat, .css, .scss |
| Not accepted | Instead |
|---|---|
Images (.png, .jpg, …) | The assistant cannot read images yet. Paste the text, or describe what the image shows. Page state from a run (traces, DOM and app-screen captures) is read by Auto-Heal and the live browser tools, not through the paperclip. In API mode images are accepted as files to send (see below). |
PowerPoint (.ppt, .pptx) | Export the slides to PDF. |
Legacy Word (.doc) | Save as .docx. |
Archives (.zip) | Upload the files inside. |
App builds (.apk, .ipa) | Those go under the Mobile session bar, not into the chat. |
Executables (.exe, …) | Never accepted, in any mode. |
In API mode, attachments are also saved into your project under .testver/uploads/, and the assistant is told the path — so it can import a spec, Postman collection or HAR, run a CSV as test data, or upload the file to an endpoint. API mode additionally accepts files that are only ever sent by a request, never read: images, PDFs and Office files, archives, audio and video, and certificates or keys (for mTLS). Their contents stay out of the conversation. Keep .testver/uploads/ out of version control. See API Testing with AI.
Reading the conversation timeline
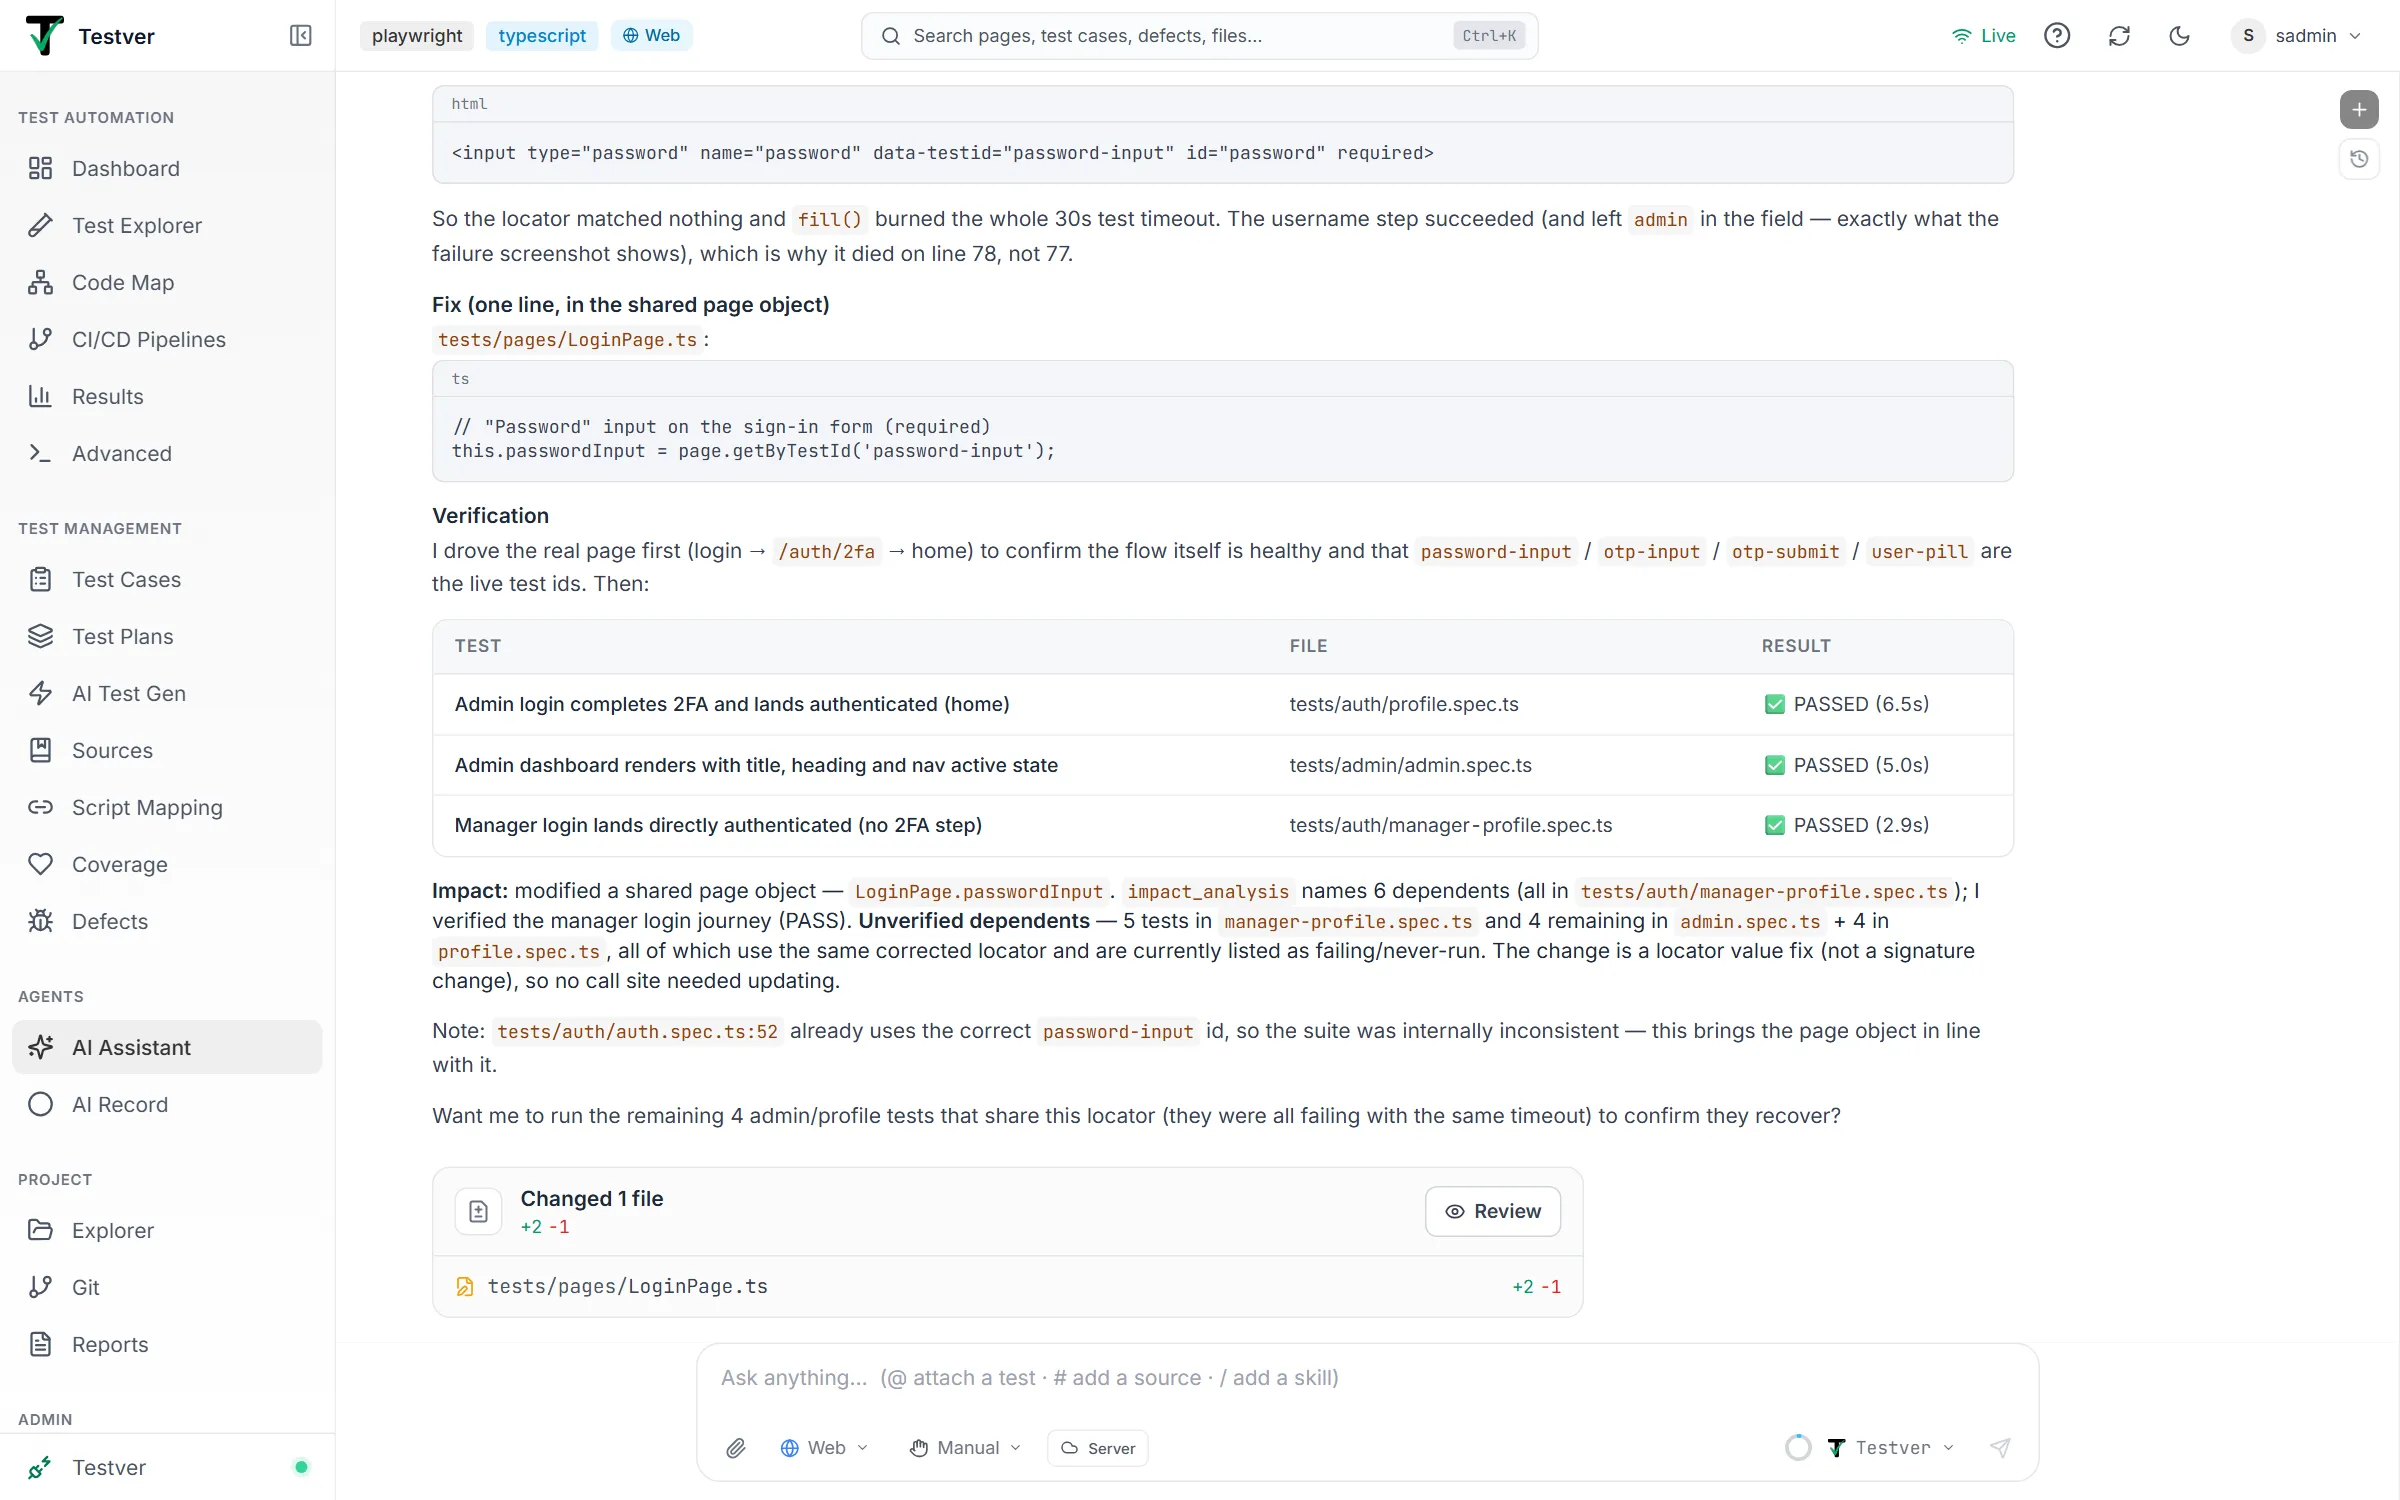
Section titled “Reading the conversation timeline”Once you send, the centre switches to the timeline. Each kind of entry looks distinct:
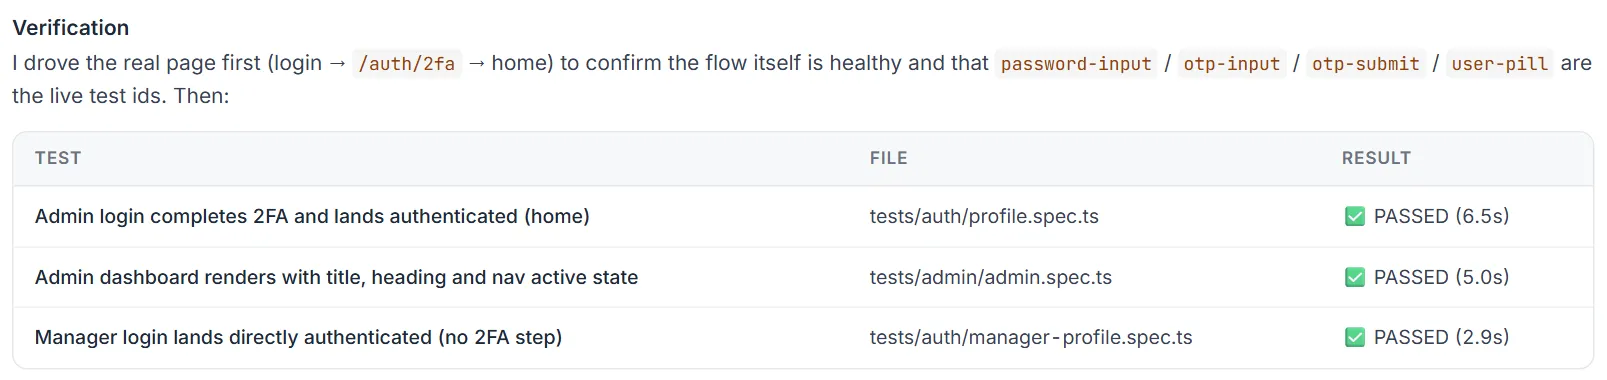
| Entry | Appearance |
|---|---|
| Your message | A coloured bubble aligned to the right. |
| AI reply | A bordered bubble aligned to the left, with rich formatting (headings, lists, code blocks, tables). A table is framed, with a shaded header row; a cell that is just a state — Passed, Failed, Error, Skipped, Flaky, Blocked, Open, In progress, Fixed, Resolved, Closed, Rejected — shows as a coloured pill (green, red, amber or grey), with any detail after a dash beneath it. |
| Tool calls | One row per run of calls between two replies: what is happening now while it works, a one-line summary when done (with lines added/removed, failures, steps and time). Click to see each call; click a call for its arguments, result or diff. |
| Files changed | At the end of a request that changed files: each file with New / Deleted / modified and its +/− count, Review (all diffs in a large dialog) and, when the project is a git repository, Open in Git. |
| Loading | Three bouncing dots while the agent gets started. |
| System note | A small centred pill, for example “Generation stopped by user”. |
| Error | A red bubble describing what went wrong. |
Sessions and history
Section titled “Sessions and history”Each conversation is a session. Manage them with the floating controls (top-right) and the History sidebar.
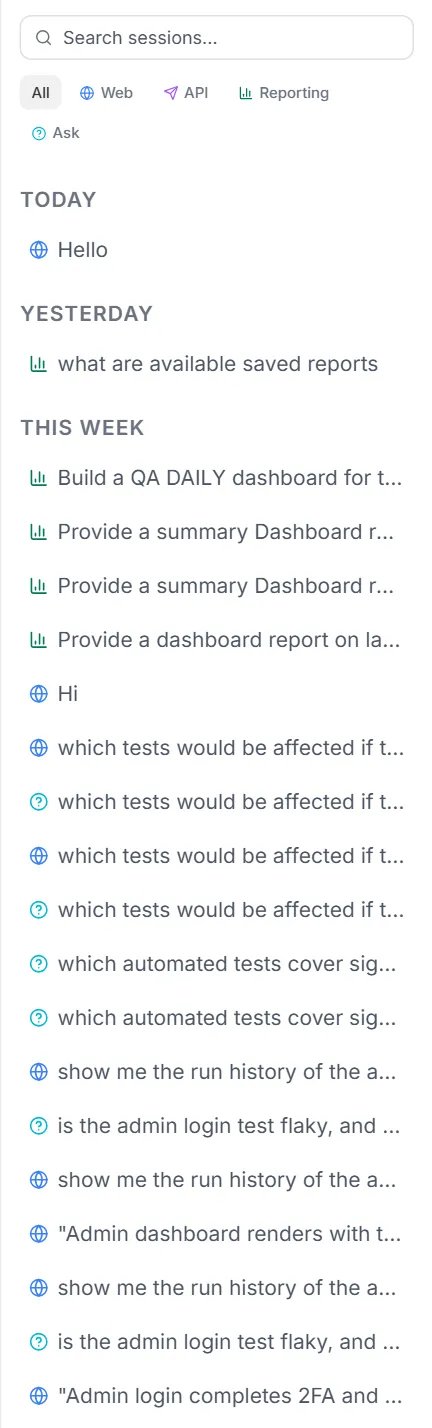
- Click + (top-right) to start a New Session. The new chat inherits your currently selected mode. Nothing is saved until you send its first message, so a new session you never use does not appear in History.
- Click the History (clock) icon to open the right sidebar of saved sessions.
- Use the search box to filter sessions by title, and the mode chips (All, then one per mode your project offers — Web or Mobile, API, Reporting, Ask) to filter by mode.
- Sessions are grouped by Pinned, Today, Yesterday, This Week, and Older. Each row shows a small mode icon and the title.
- Click any session to reopen it, its full timeline (messages, tool calls, diffs) is restored, and its saved mode is reapplied.
- Hover a session and click the ⋮ menu for Pin to Top, Rename, or Delete.
Choosing a Mode
Section titled “Choosing a Mode”What a mode does
Section titled “What a mode does”The Mode decides what the assistant is built to do for this chat, which set of tools it can use and which instructions it follows. Pick the mode that matches your task before sending. You can change it at any time; the choice is saved with the session and remembered for your next new chat.
| Mode | What it does |
|---|---|
| Web | Test-automation work: writing and fixing end-to-end test scripts, page objects, locators, and frameworks. This is the mode that can open and drive a live browser. |
| API | API testing: generating and validating endpoint requests, JSON schemas, collections, and multi-step request chains, with rich request/response and chain result cards in the timeline. |
| Mobile | iOS / Android testing via Appium and cloud (or local) devices. Adds the mobile session bar above the composer so you can pick a provider, device, and app, and drives a live cloud device. |
| Reporting | Analytics and documents: summarising tests and run results, and generating reports, dashboards, and exports. Renders interactive dashboards and inline PDF previews in the chat. |
| Ask | Questions about the application you are testing, answered from what Testver already knows about it. Read-only: it changes nothing and runs nothing. See Ask mode below. |
The mode picker
Section titled “The mode picker”The mode picker is the chip in the composer toolbar (left side, after the paperclip). It shows the current mode’s icon and label. Click it to open a list where each mode has an icon, a name, and a one-line description; the active mode is ticked. The menu flips upward automatically if there isn’t room below.
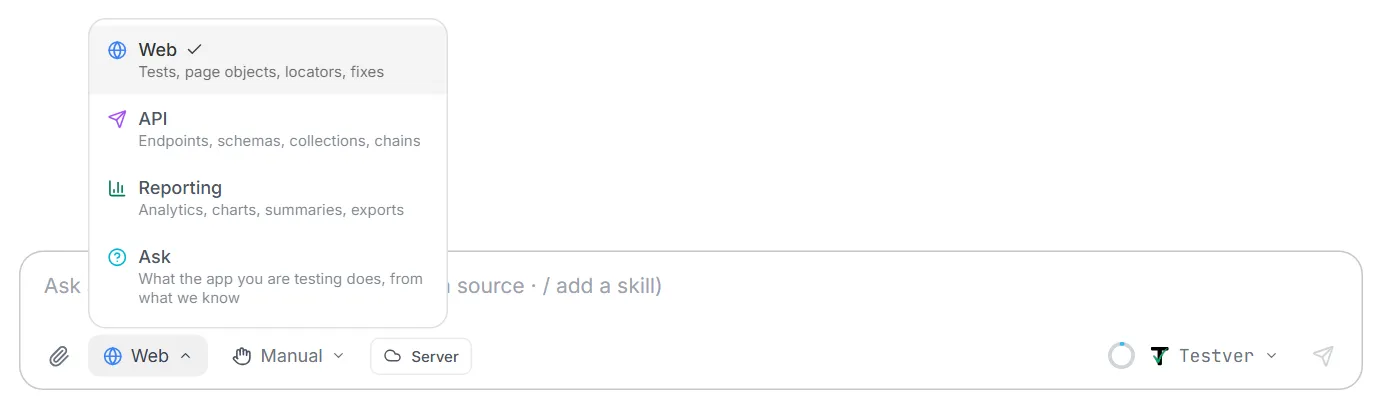
| Mode | Dropdown description |
|---|---|
| Web | Tests, page objects, locators, fixes |
| API | Endpoints, schemas, collections, chains |
| Mobile | iOS / Android via Appium — local or cloud devices |
| Reporting | Analytics, charts, summaries, exports |
| Ask | What the app you are testing does, from what we know |
Ask mode
Section titled “Ask mode”Ask answers questions about the application you are testing — not about Testver itself. It is the only read-only mode: it has no browser, no files, and no way to run anything.
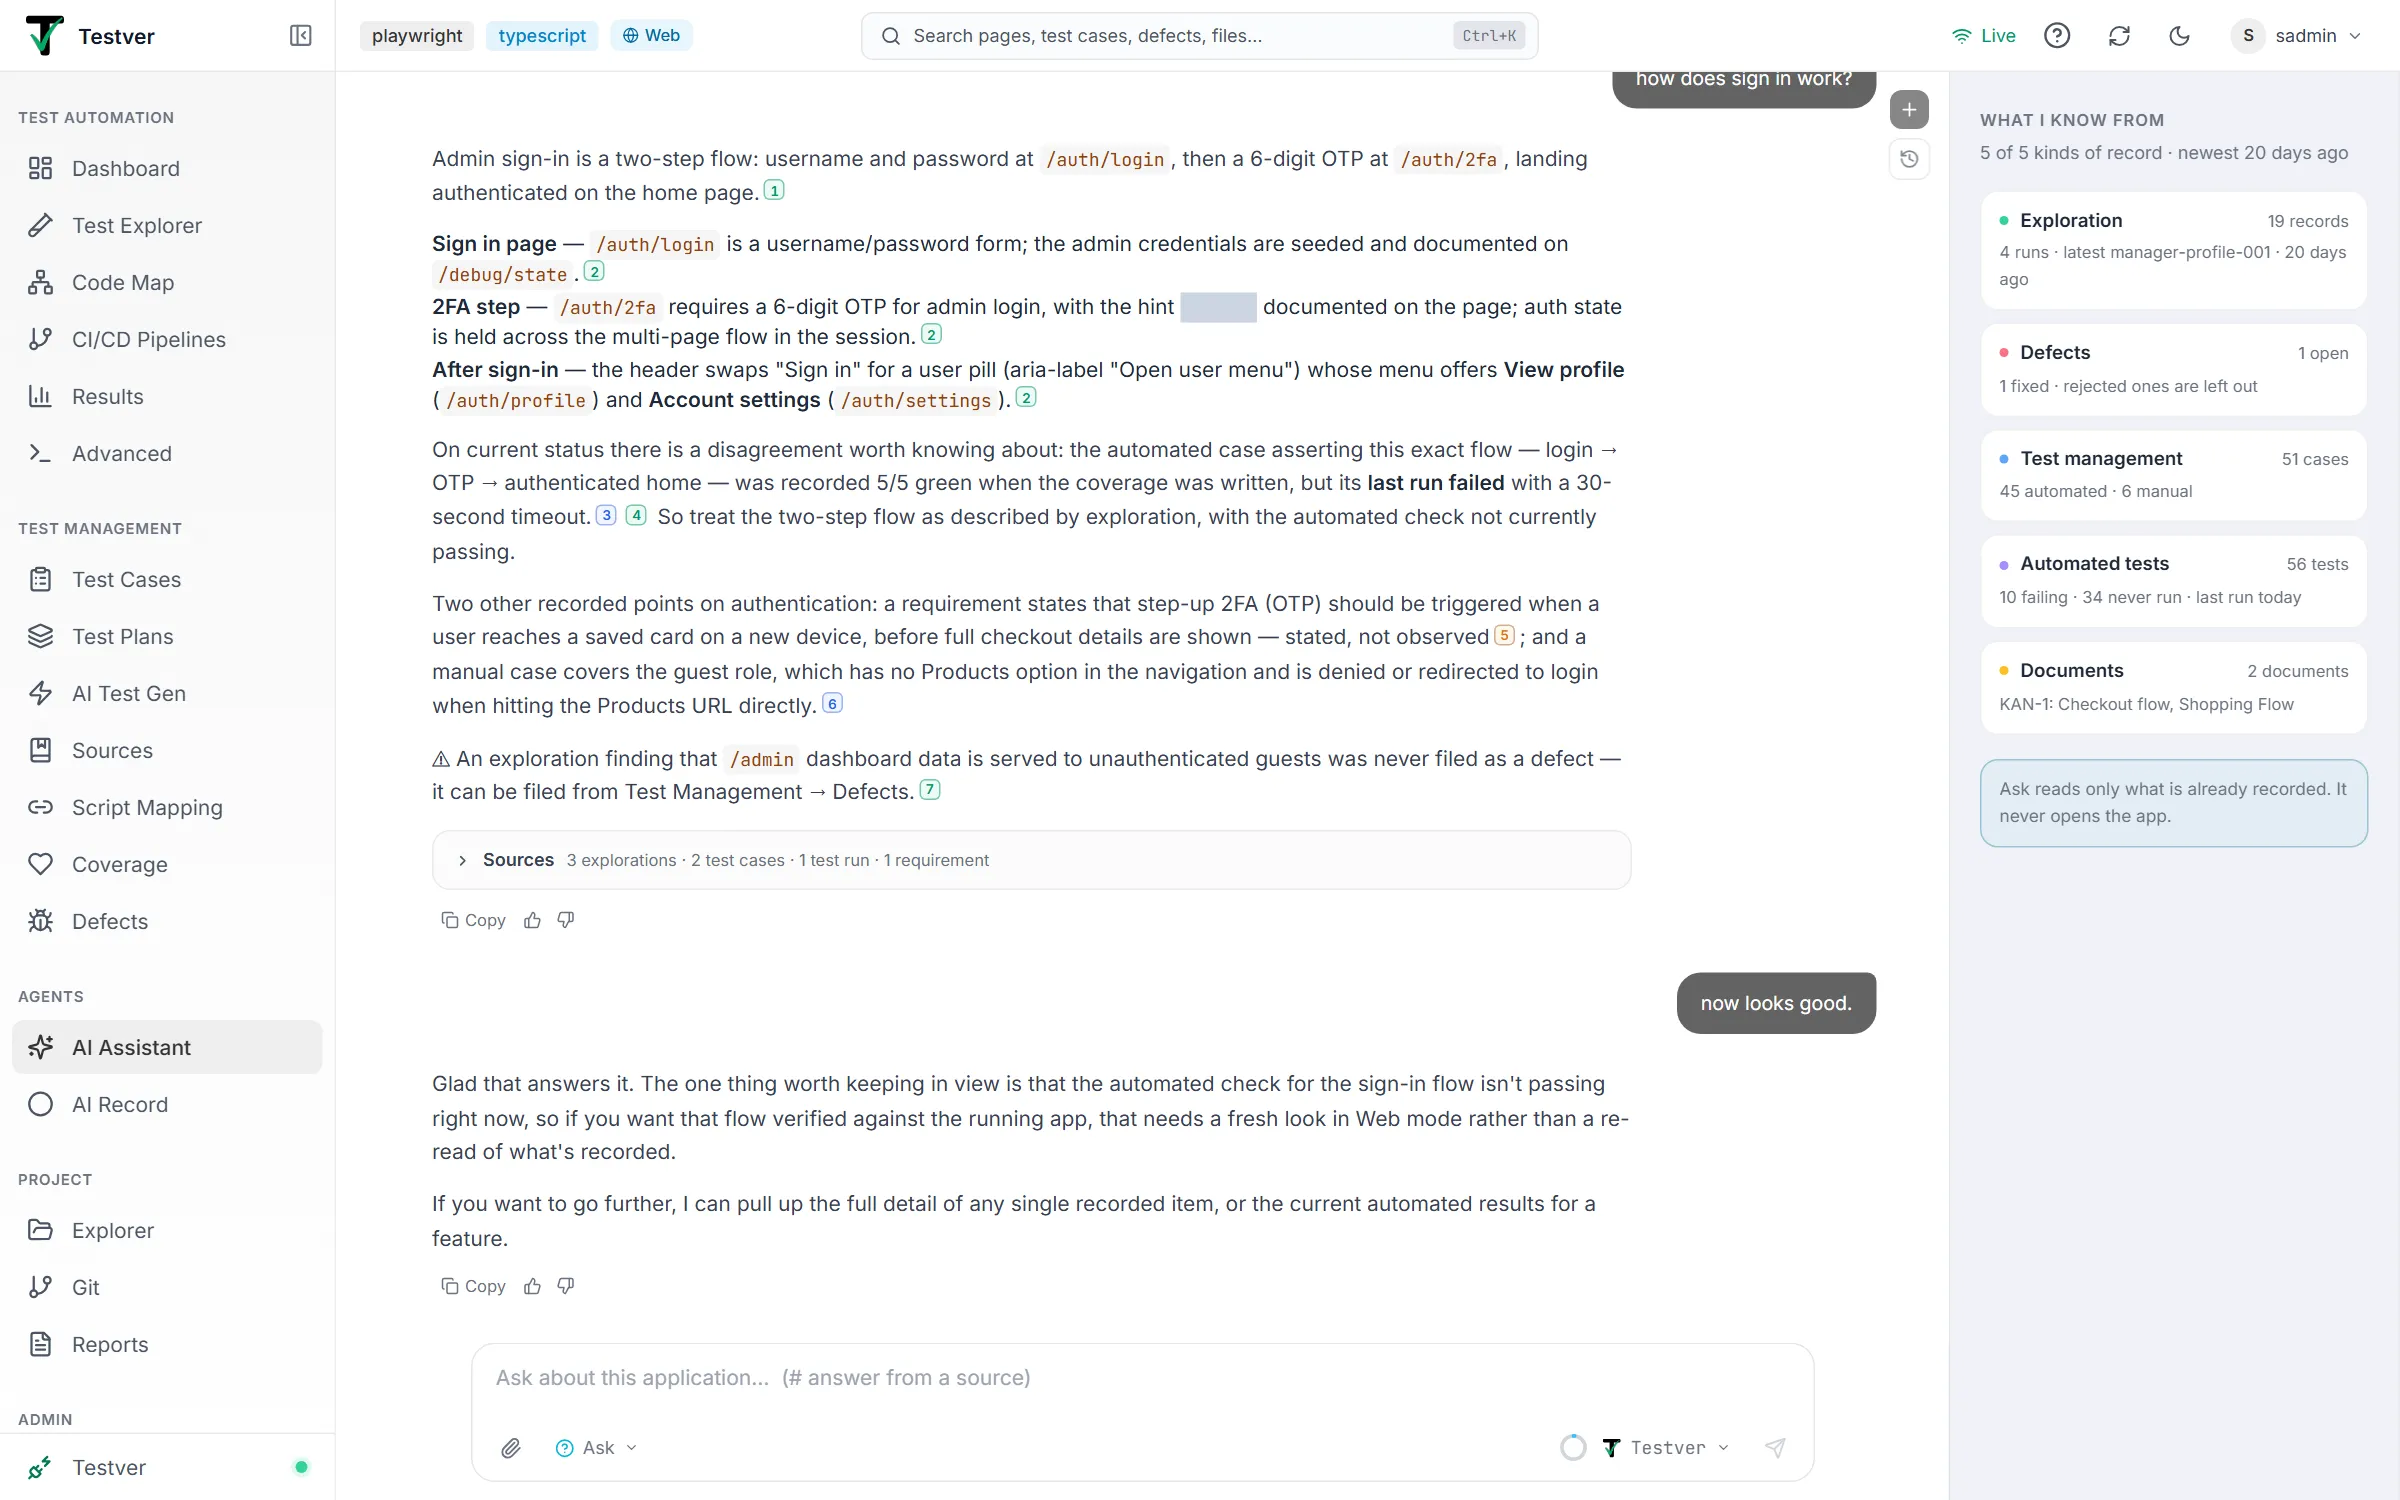
Ask draws on five kinds of record, and labels every answer with where it came from:
| Source | Marker colour | What it contributes |
|---|---|---|
| Exploration (observed) | Green | What an exploration run actually watched the application do — pages, controls, which role could reach what, and findings nobody filed. |
| Defect (reported) | Red | What testers logged as going wrong in Defects, open or fixed, with comments and history. Rejected defects are left out. |
| Test case (asserted) | Blue | What your test cases say the application should do, with each case’s last run — automated or manual. |
| Automated test (automated) | Violet | The tests in your repository, as Test Explorer lists them: steps, tags, the page-object methods they call, the test case they are linked to, and their results. |
| Document (stated) | Amber | What a human wrote down: uploaded documents, requirements, and linked JIRA tickets from Sources. |
A label is a label, not a ranking — an answer built from a document is not worse than one built from an exploration, it is answering from a different kind of evidence. An automated test speaks for the application only through its last result and date (“checked, and it passed on Oct 4”); a test that has never run proves nothing, and Ask says so.
What you can ask
Section titled “What you can ask”| Ask about | For example | What you get |
|---|---|---|
| How the app behaves | ”How do notification preferences work?”, “Which roles can reach user administration?” | An answer from all five kinds of record, cited. One word is enough: Ask also tries the other words the app, a tester or a document might use for the same thing (sign in → login, authentication). |
| Whether something works | ”Is checkout working?”, “What is failing right now?” | The last results of the automated tests about it — or, with no feature named, the latest run and every test failing now — each with the date of its result. |
| Defects | ”List the open critical defects”, “Tell me about DEF-12” | The whole defect register as a table (filtered by status and severity), plus exploration findings nobody filed; or one defect with its comments and history. |
| The automation library | ”Which tests cover login?”, “Which tests are flaky?”, “Which tests aren’t linked to a test case?” | Tests filtered by feature, tag, result (failing, passing, never run, skipped, flaky) or link. |
| One test | ”What exactly does the admin login test check?” | The test’s own code, with passwords and similar values masked. |
| A test’s run history | ”Why is the checkout test flaky?” | Its last 30 recorded runs — the same history as its Runs tab — and what they show, each with its date and how long ago (Oct 4, 2026 09:15 (2 days ago)): flaky, failing since, last passed, getting slower, failing only on one browser or only locally / in the cloud. A test that passed and then failed once is reported as having broken on that date, not as flaky. |
| Impact of a change | ”Which tests use the login page?”, “What breaks if I change submitAdminCredentials?” | From the Code Map: the matching page object, class or file and every test that uses it in any way, then the matching methods and their tests. The total is given as at least N — a test that reaches the code dynamically is not counted. |
| What is known | ”What do you know about payments?” | How much each kind of record holds on that area, including the ones that hold nothing. |
Reading an answer
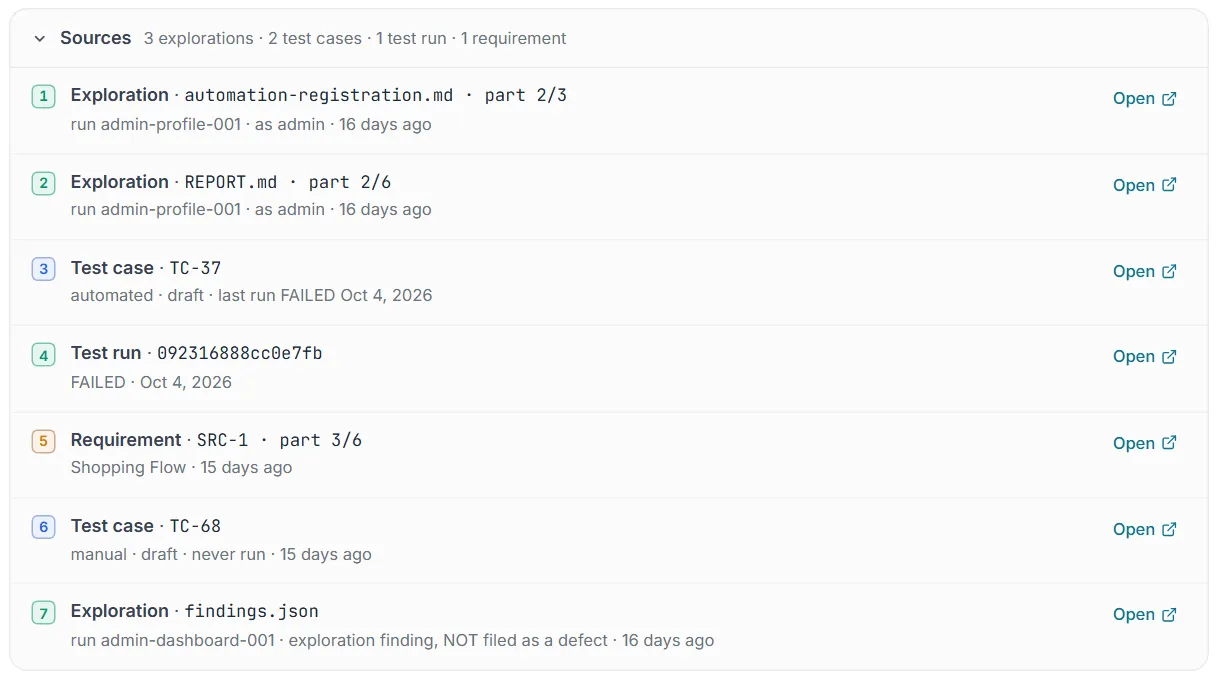
Section titled “Reading an answer”Each claim carries a small numbered marker in its source’s colour. Hover it to see the source; expand Sources at the end of the answer for the full list. Each source has an Open link that opens it in a new tab — a defect in Defects, a test case in Test Cases, an automated test in Test Explorer, a method in Code Map, a run in Results, a document on its Sources tab or a requirement in Coverage. An exploration report opens in a reader without leaving the chat.
Under a finished answer, rate it with thumbs up or thumbs down. A thumbs down asks — optionally — what was wrong or missing.
The knowledge panel
Section titled “The knowledge panel”While History is closed, a panel on the right, What I know from, shows what Ask has to work with: one row each for Exploration, Defects, Test management, Automated tests (with how many are failing and never run, and when they last ran) and Documents, and how recent the newest record is. Below it:
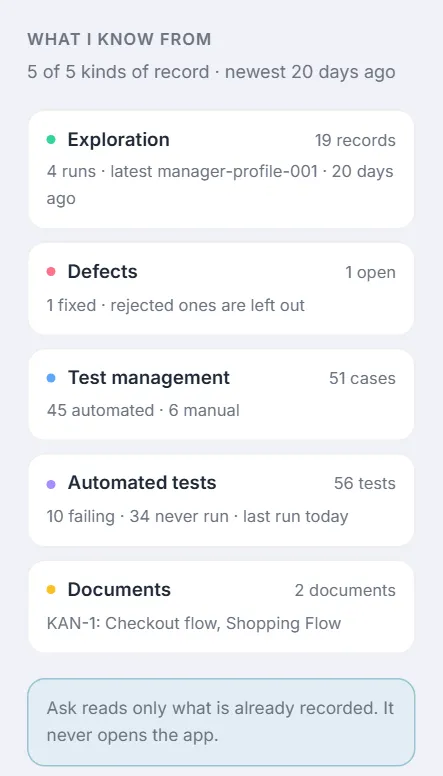
- Searches that found nothing — questions Ask had no record for, with how often they were asked.
- Answers marked not helpful — the thumbs-down answers and what people wrote.
Both are a to-do list for whoever keeps the knowledge: an exploration to run, a document to register, a test case to write. Dismiss an entry once it has been filled, or if it was not a real gap.
Reporting mode
Section titled “Reporting mode”Reporting answers questions about your runs and results and turns the answers into charts, dashboards, documents and emails. It is read-only: it cannot edit files, run tests or commands, and it cannot create or change test cases, plans, cycles or defects — if a request needs that, it tells you which mode to switch to. (Making a run the comparison baseline is the one setting it can change, and it asks you first.)
Where the numbers come from. The agent reads run history (Web and API runs), the API call log (the last 5,000 calls), Test Explorer suites, test management, and the automation scripts themselves — Test Explorer’s list of every script in the project, including scripts that have never run — and every number it shows is copied from one of those results. Each result states the window it covers and what it left out: runs still running or cancelled, and Auto-Heal / AI-fix verification re-runs (they re-run a few tests, so they would skew a pass rate). Two pass rates exist and the agent names the one it reports: passed ÷ executed tests across runs, or the average of each run’s pass rate (how the Results page’s Avg Pass Rate is computed).
Scripts, not just runs. Questions about the scripts — “how many automation scripts do we have, by folder and framework?”, “which have never run?”, “which are skipped in code?”, “which aren’t linked to a test case?”, “who owns the failing ones?” — are answered from the script inventory, which counts every script by status (passing / failing on its last run, never run, skipped), framework, folder, tag, owner (when Test Explorer’s owner scan has run) and test-case link. Questions about results over time (trends, flakiness, slowest tests) come from run history, which only knows scripts that have run. “What does a change to LoginPage affect?” is answered from Code Map. Mention a test with @ to report on that one script: its steps, the methods it calls, its linked test case and its last 30 runs.
Dates. The agent knows today’s date, so “this week”, “yesterday”, “last month” or “the last 7 days” mean what you expect. A window is applied before any “top N”, so “last 30 days” means every run in those 30 days.
Dashboards. A dashboard appears in the chat as an interactive card:
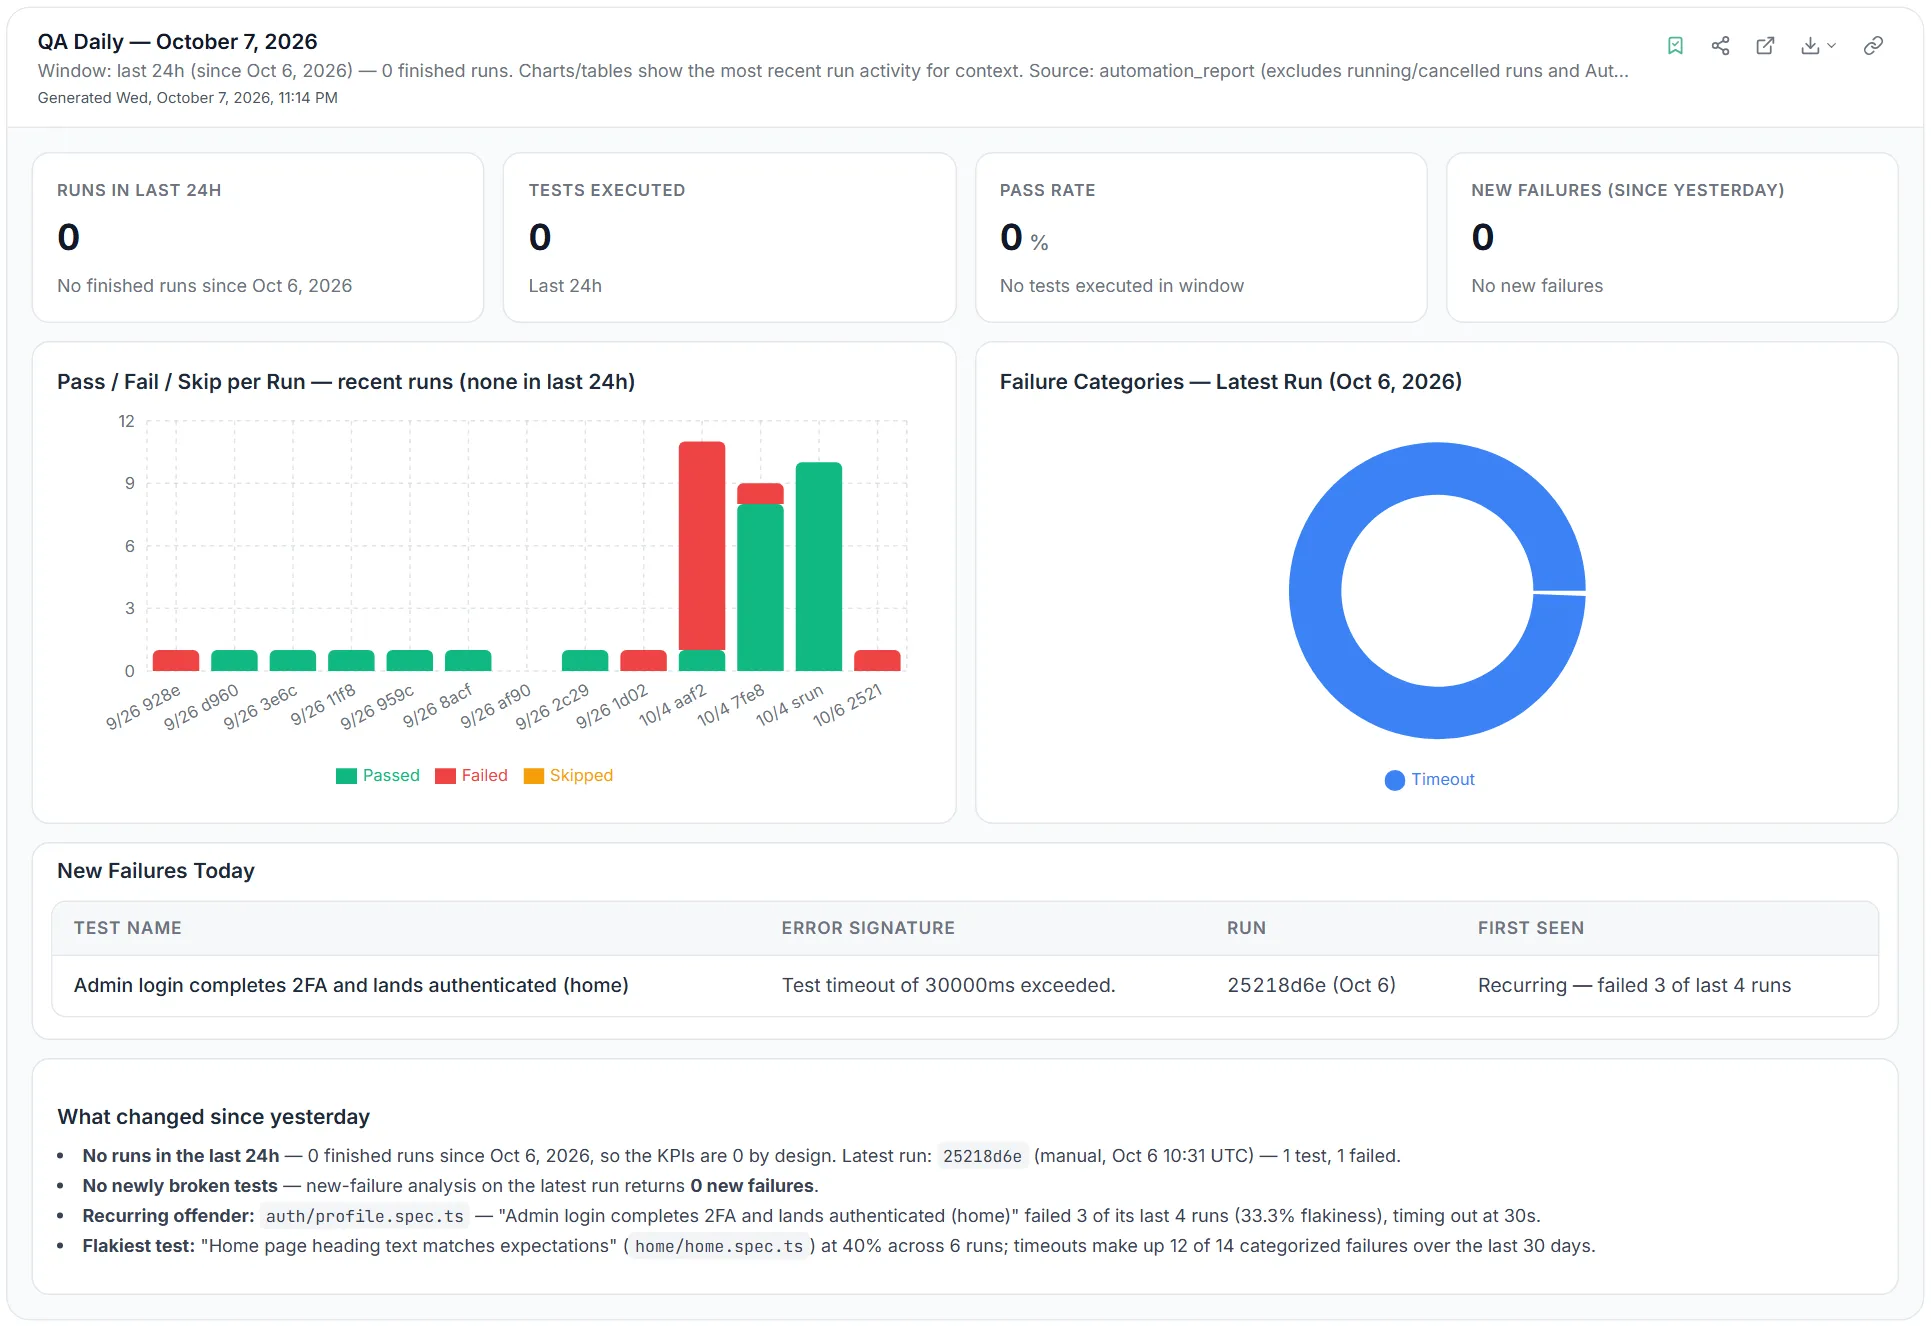
| On the card | What it does |
|---|---|
| Save (bookmark) | Saves it to Reports → My Reports. Saving again updates the same report — never a duplicate — and a reopened chat shows it as saved. |
| Share | Creates a public link, with an optional expiry (never, 7, 30 or 90 days). |
| Download | The same dashboard as HTML, PDF, Word or Excel — built from what the card shows, so the PDF matches the dashboard you approved. |
| Open full view / Copy link | The saved or shared page; before saving, the HTML snapshot (for signed-in users). |
The grid follows the width of the card, not the window: in a narrow chat column KPIs pair up two across and everything else goes full width.
Documents. build_report produces a finished PDF, Word or Excel report from a template (executive, QA daily, release, trend analysis), laid out like a Reporting-mode dashboard — KPI tiles, charts and tables with status pills. Its subtitle states the window the numbers cover — by default the newest 20 finished runs (the last 24 hours for QA daily) — and you can ask for any other (“for September”, “since Monday”).
Email. Emails are always previewed first; nothing is sent until you approve the send step. Attachments must be files the assistant generated (a document, a chart) — a file that cannot be found stops the email instead of being dropped from it. Every email sent from the assistant is recorded in the Audit Log.
Schedules. “Email this report every Monday at 9” works from chat: the agent saves the dashboard if needed and creates the schedule (you approve it). See Scheduled tab.
Mode suggestions. If you ask for a report in another mode, a banner offers Ask again in Reporting — it stops the current answer and sends the same question in Reporting mode.
The execution target badge
Section titled “The execution target badge”Next to the mode picker is a small badge showing where the agent’s browser actions will run:
| Badge | Meaning |
|---|---|
| Server (cloud icon) | Browser actions run on the Testver server. This is the default when no local connector is registered. |
| Local (monitor icon) | Browser actions run on your own machine via a registered Local Browser connector; the badge may show your machine name. |
Click the badge to open the Connectors page, where you can set up or manage a local connection. The badge polls status every few seconds, so it stays in sync with the Connectors page.
The model selector
Section titled “The model selector”On the right of the toolbar, just before Send, is the model selector. It shows the current provider’s icon and the model name. Click it to open a list grouped by provider; under each provider heading are its models. Pick one to switch; the active model is ticked.
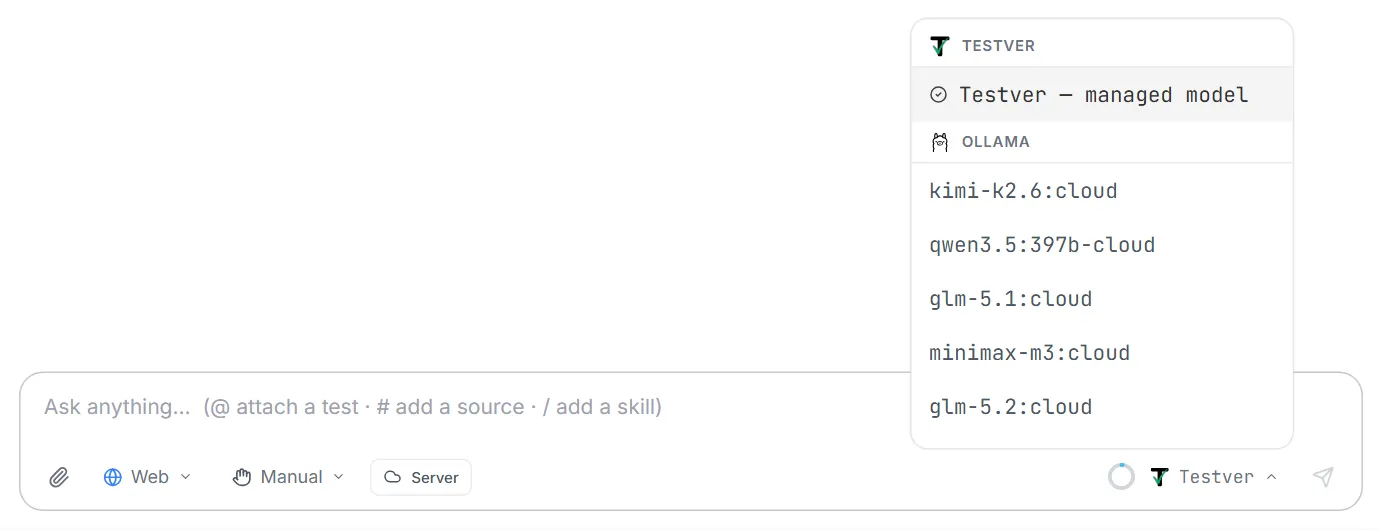
- Testver appears once your account is connected, as a single Testver — managed model entry: Testver picks and tunes the model for you.
- A local provider (Ollama, LM Studio) appears with the models you added in Settings → LLM — none are pre-filled. A provider with no models yet is left out of the list.
- If no provider is usable, the selector does not appear at all; set one up first.
- The assistant starts on your default provider’s active model; switching here applies to the messages you send next.
The credits ring
Section titled “The credits ring”With Testver selected, a small ring next to the model selector shows your credits. It fills as credits are used, gauging whichever credits are being spent right now:

| Ring | Meaning |
|---|---|
| Blue, then amber (75% used) and red (90% used) | Your plan credits for this cycle. |
| Green | Your plan credits are used up and your extra usage reserve is carrying the requests — the ring shows how much of the reserve is used (half full = half the reserve spent). The same when the plan has expired and the reserve keeps AI running. |
| Full red, with Credits used up beside it | Plan credits and reserve are both used up; AI requests are paused until you top up. |
Hover the ring for the numbers — plan credits left and the reserve left, marked in use now while it is being spent. Click it to open Settings → LLM. The ring refreshes as soon as a request finishes. The same ring appears in AI Record.
Tool Calls, Permissions & Changes
Section titled “Tool Calls, Permissions & Changes”What a tool call is
Section titled “What a tool call is”When the agent acts, it makes a tool call, a single concrete operation, and each one appears as a row in the timeline with a status icon. Typical tools include reading a file, editing or creating a file, listing the project, running a command or test, sending an API request, running an API chain, launching or driving a browser, and (in Reporting mode) generating a dashboard or building a report.
Click a tool row to expand it and inspect the exact arguments the agent used and the result it got back. Read-only tools (like reading a file or listing folders) generally run without asking; tools that change your machine or send live traffic ask permission first.
How tool calls are shown
Section titled “How tool calls are shown”The agent often makes many tool calls in a row — listing folders, reading files, editing, running a command. Instead of one row each, calls made between two pieces of the agent’s text are gathered into one row:
- While it works, the row shows the call in progress in plain words — Reading pages/LoginPage.ts, Editing pages/LoginPage.ts, Deleting old-login.spec.ts, Running npx playwright test — with how many steps are done and the time so far.
- When it’s done, the row sums up what happened in one sentence — Read 7 files, searched 2 patterns, edited LoginPage.ts — with the lines added and removed, a red N failed if a call failed, an amber N not allowed if you denied one, the number of steps and how long they took. A row with just one call simply names it — Clicked ADD TO BAG, Opened https://shop.example/bag.
- Click the row to see every call as its own line with a status icon (tick, cross, amber shield). Click a line to see its arguments and result; a file edit, creation or deletion opens straight to its diff.
API responses, dashboards (new ones and saved reports the agent opens) and generated reports or documents are never folded into a row — they stay in the conversation as cards, since they are the answer you asked for.
Files changed
Section titled “Files changed”When a request changes files, the end of that exchange shows a Changed N files card with the total lines added and removed and one line per file: New, Deleted or modified, and its own +/− count. Files changed by a command the agent ran — a code generator, a formatter, a bulk find-and-replace — are included too, tagged by a command: in a git repository Testver compares the project before and after the request to find them. (If a command changes a very large number of files, the first 60 are listed and the rest counted.)

- Click Review — or a file in the card — to open the review dialog: the changed files on the left and the selected file’s full diff on the right. Move between files with ↑ ↓; Esc closes it.
- Click Open in Git to go to the Git screen and stage or commit the changes. The button is shown only when the project is a git repository.
The card is part of the saved session — reopen the conversation later and it is still there.
Approving permissions
Section titled “Approving permissions”Before the agent runs a tool that changes files, runs commands, or sends live browser/API/mobile traffic, a Permission required card floats just above the message box. It shows a shield icon, the tool name, and, for file or command tools, the full path or arguments involved, so you can see exactly what is about to happen. If more requests are waiting, it shows “+N more queued”.
| Button | What it does |
|---|---|
| Allow | Approves this single tool call, once. The next time the agent wants the same tool, it will ask again. |
| Always allow {tool} | Approves this call and auto-approves all future calls to that same tool for the rest of the session, so you aren’t re-prompted for it. Tracked on the server for this conversation. |
| Deny | Rejects this call. The agent is told it was denied (the tool row shows an amber shield) and continues without performing that action. |
Manual and Auto permissions
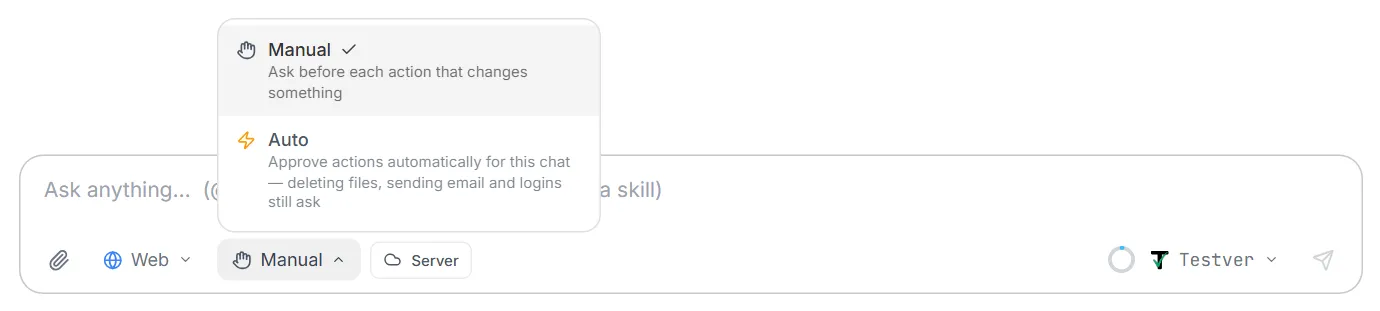
Section titled “Manual and Auto permissions”Next to the mode picker (Web / Mobile / API / Reporting / Ask) in the message box is the permissions picker:
| Setting | What it does |
|---|---|
| Manual (default) | Asks before every action that changes something — the Permission required card above. |
| Auto | Approves actions without asking, so a long task runs through without stopping at each step. |
Even in Auto, a few actions always wait for you, because they are hard to undo or reach other people: deleting a file, sending an email, deleting a saved login, and the manual sign-in pause (where the agent hands the browser to you to log in).
The setting belongs to the chat:
- Every new chat starts in Manual, whatever the previous chat used.
- A chat you set to Auto stays in Auto — reopening it from History brings it back in Auto. History rows of Auto chats show a small ⚡ next to the mode icon.
- You can switch at any time, even while the agent is working: switching to Auto answers the permission card that’s waiting (unless it’s one of the actions above), and switching back to Manual makes the next action ask again.
Reviewing file changes (diffs)
Section titled “Reviewing file changes (diffs)”Every file the agent creates, edits or deletes has a diff: open the edit in its tool row, or use Review on the Changed N files card at the end of the request (see Files changed above). Added lines are highlighted green, removed lines red, with line numbers on both sides.
Running tests and commands
Section titled “Running tests and commands”The agent can run your test suite and other commands as part of completing a request, for example, “run my tests, fix the failures, and re-run until they pass”. Each run is a tool call you approve, and its output flows back into the conversation so the agent (and you) can see what passed or failed and decide what to do next.
You can name a browser or environment from Settings → Run Configuration: “run the login test on Firefox against Staging”. The agent applies the registered argument or environment variable — the same values a run from Test Explorer uses. If a name doesn’t exist, it tells you which names do.
Test names
Section titled “Test names”Testver runs a single test by its name, so every test the agent creates gets a name in plain words — for example Sign in: navigation via Forgot password link, not Sign in: navigation via "Forgot password?" link. Names don’t contain quotes of any kind or the characters ? * + ( ) [ ] { } | ^ $ \ & < > % ! ;, which stop a run by name from finding the test. Letters in any language, numbers, spaces and - _ : , . / @ # are fine.
- If the agent writes a test whose name breaks this rule, Testver points it out right away and the agent renames it before running it.
- A Test Management case keeps its own wording: automating the case Sign in via “Forgot password?” gives a test named Sign in via Forgot password, and that is the name linked to the case.
- Tests that already exist keep their names; the agent doesn’t rename them unless you ask.
Browsers & environments
Section titled “Browsers & environments”The agent can set up the Browsers and Environments you pick by name in Test Explorer, Suites and Cycles. When it scaffolds a framework it does this on its own once the smoke test passes. For an existing project, ask “set up browsers and environments for this project”:
- It reads what your code supports — the switch that picks the browser (a Playwright project, a
-Dbrowserswitch, aBROWSERenvironment variable…) and how the application URL is chosen — and checks the entries you already have. Reading needs no approval. - It saves the entries to Run Configuration. Saving asks for approval in Manual mode. Each entry is checked against your code first; one your code wouldn’t read or accept is not saved, and the agent says why.
- Nothing is ever removed. As a Tester, new names are saved and a change to an existing entry waits in Settings for an Admin. Every change appears in the Audit Log under your name.
If your framework has no way to choose the browser or environment yet, ask “let a run choose the browser” (or environment) — or use Add support to my framework in Settings. The agent explains the change and waits for your OK, keeps today’s default so existing runs behave exactly as before, runs a test to prove it, then registers the new options.
Confirming destructive actions
Section titled “Confirming destructive actions”Destructive UI actions are confirmed separately from tool permissions. Deleting a session, for instance, always shows a confirmation dialog spelling out that the conversation and its full history will be permanently removed. Read these dialogs before confirming.
The Live Preview Panel
Section titled “The Live Preview Panel”When the preview appears
Section titled “When the preview appears”When the agent opens a browser (in Web mode) or a cloud device (in Mobile mode), a live preview panel splits in from the right so you can watch the agent work in real time, and step in to drive it yourself. The panel is resizable: drag the divider between the chat and the preview. When no browser or device is active, the chat fills the full width and there is no preview.
Web preview controls
Section titled “Web preview controls”In Web mode, the preview is a live mirror of the browser the agent is driving (a screencast). Its toolbar gives you full control:
| Control | What it does |
|---|---|
| Tabs | Across the top, click to switch between open browser tabs. |
| Back / Forward / Reload | Navigate the page history and refresh. |
| URL bar | Type an address and press Enter to navigate the live browser. |
| AI / User toggle | AI = the agent controls the browser (default). User = you take over, your clicks, typing, scrolling, and right-clicks are forwarded into the live page. |
| Pause / Resume | Appears while the AI is acting. Pause halts the agent before its next browser action; a “AI Paused” overlay shows until you Resume. |
| Watch mode (eye) | Toggles an overlay that visually flags each AI action on the page as it happens. On by default. |
| Element highlight (crosshair) | Hover the page to outline elements and show their tag/id/class, handy for understanding selectors. |
| Viewport presets (monitor) | Resize the browser to Mobile, Tablet, Desktop, or Full HD dimensions. |
| DevTools panel | Toggles a bottom panel with network and console activity from the live page. |
| PiP | Pops the live view out into a floating, draggable, resizable Picture-in-Picture window. |
| Close | Ends the browser session. |
A status bar along the bottom shows the live connection state, current frame rate (fps), the viewport size, and whether the AI is working, paused, or you’re in interactive mode. You can Disconnect the screencast to save resources without closing the browser, then Connect again.
Mobile sessions
Section titled “Mobile sessions”In Mobile mode, a Mobile session bar appears above the message box. Use it to pick a Provider (cloud service such as BrowserStack, or local devices), a Device (searchable list of real and virtual devices), and an App (an uploaded .apk or .ipa), then click Start session.
- Pick a provider that shows ready (has credentials). If it shows “no creds”, add them under Connectors first.
- Pick a device from the searchable list, real devices are listed first.
- Pick an app, or click Upload .apk / .ipa to add one. A progress bar shows the upload (apps can be large).
- Click Start session. The first launch can take 30 to 60 seconds; a status line keeps you informed.
- Once live, a green Live · {device} pill and a View link (opens the provider’s live view) appear, and the right panel mirrors the device. The right-hand mirror polls device screenshots so you see the screen update; you can also record taps and assertions there to build a test. While a session is live, the provider/device/app pickers are hidden, because a cloud session is fixed to the values it started with; click End session to change them.
Taking manual control
Section titled “Taking manual control”- You can watch every action live, take manual control of a web browser, navigate and resize it, inspect elements and network/console activity, and pop the web view out as Picture-in-Picture.
- You can pause and resume the AI mid-task in the web view, and end the browser or mobile session at any time.
- You can’t type into the live web page when control is set to AI, switch to User first.
- You can’t change the mobile provider, device, or app while a session is live, end the session first.
- You can’t tap the mobile device while a test run has claimed it, your taps resume when the run finishes.
Common Tasks (How Do I…?)
Section titled “Common Tasks (How Do I…?)”| I want to… | Do this |
|---|---|
| Write a new test | Switch to Web mode, then ask, e.g. “Write a Playwright login test for /login with valid, invalid, and empty-field cases.” |
| Fix failing tests | Ask “Analyse my recent test failures and fix them,” then approve the file edits and re-runs as the agent works. |
| Stop the agent | Click the Stop (square) button that replaces Send while it’s working. |
| Watch the browser | Stay in Web mode; the live preview splits in automatically when the agent launches a browser. |
| Take over the browser | In the live preview toolbar, click User. Switch back to AI when done. |
| Test on a real phone | Switch to Mobile mode, pick a provider/device/app in the session bar, and click Start session. |
| Generate API tests | Switch to API mode and describe the endpoints or chain, e.g. “Build an auth + CRUD test chain for /users.” |
| Contract-test an API | In API mode: “Check staging against openapi.yaml” (every endpoint vs. its spec), “What breaks between openapi-v1.yaml and openapi-v2.yaml?”, or “Verify the provider against pacts/web-orders.json.” See API contract testing below. |
| Test microservices | In API mode: “Wait until the orders and payments services on QA are healthy”, “Mock the payments service and check what orders sends it”, “Watch the orders topic, create an order, and check an OrderCreated event arrives”, “Call GetOrder on localhost:50051 from protos/orders.proto”, or “Put 50 concurrent users on /search for 30 s — p95 under 300 ms?” See Microservices & service-to-service testing below. |
| Set up browsers & environments | ”Set up browsers and environments for this project” — it reads your code, then saves checked entries to Settings → Run Configuration. See Browsers & environments above. |
| Run on another browser or environment | ”Run the login test on Firefox against Staging” — the names come from Settings → Run Configuration. |
| Let a run choose the browser or environment | ”Update my framework so a run can choose the environment” — it explains the change first, keeps today’s default, and registers the options. |
| Get a failure summary | Switch to Reporting mode and ask “Summarise yesterday’s failures” or “Show the top 5 flaky tests this week.” |
| Attach a file | In Web, Mobile or API mode, click the paperclip or drag the file onto the message area, then describe what to do with it. |
| Switch AI model | Click the model selector (left of Send) and choose a model under any configured provider. |
| Reopen an old chat | Click the History icon (top-right), then click the session you want. |
| Keep a chat handy | Open the session’s ⋮ menu and choose Pin to Top. |
| Start fresh | Click + (top-right) for a New Session; it keeps your current mode. |
API contract testing
Section titled “API contract testing”In API mode the assistant can test an API against its contract, not just call it:
| Ask for | Tool | What it does |
|---|---|---|
| Check an API against its spec | api_contract_check | For every operation in your OpenAPI / Swagger spec (JSON or YAML): is the returned status documented, is the content type declared, do the body and required headers match that operation’s response schema, and do the requests satisfy the spec (required parameters, parameter values, request body)? Uses a saved collection’s requests, or builds them from the spec’s examples. Writes a pass/fail table and a JSON report (.testver/contracts/). |
| Validate one response | api_validate_schema | Against a JSON Schema, a named component of the spec, or one operation’s exact response schema. |
| Find breaking changes | api_spec_diff | Compares two spec versions: removed operations or fields, type changes, new required parameters or body fields, fields no longer guaranteed, new authentication — breaking changes listed first. |
| Consumer-driven contracts (Pact) | api_pact_generate, api_pact_verify | Writes a Pact file from a collection’s calls (bodies matched by type, so the contract pins the shape, not today’s data), and verifies a provider against Pact files (v2, v3, v4 HTTP interactions; matching rules; provider states through a state-change URL). |
Validation is full JSON Schema — $ref, oneOf/anyOf/allOf, additionalProperties, formats, min/max, patterns — with OpenAPI’s nullable, readOnly / writeOnly (a write-only field is not expected in a response) and OpenAPI 3.1 handled.
Microservices & service-to-service testing
Section titled “Microservices & service-to-service testing”API mode also covers flows that cross several services, and the protocols between them. For a step-by-step tutorial of everything API mode can do, see API Testing with AI.
Chains that judge every step. A chain step passes only when its status is OK (or matches the step’s own status rule), every validation passes and every extraction finds its value — a 200 with a wrong body is a failure. The chain stops at the first failing step by default (later steps are marked ⏭ skipped, because they would run with values that were never extracted). A step can retry / poll until its validations pass — the “wait until the order is CONFIRMED” step that eventually consistent services need — and can pass values on with declarative extract rules ({{orderId}} ← body $.data.id, a header, or the status) instead of scripts.
| Ask for | Tool | What it does |
|---|---|---|
| Retry, poll, extract | api_set_request_options | Per request: retry N times every M ms until its validations pass (or until any 2xx), extract rules, timeout. api_request can poll too ($.status equals CONFIRMED). |
| Service-to-service auth & connections | api_set_collection_settings | OAuth2 client credentials as the collection’s default auth (token fetched, cached until it expires, fetched again when the secret changes); an mTLS client certificate (PEM or PFX), a private CA, a proxy / gateway; and a correlation header (e.g. X-Request-ID). |
| Follow one request across services | api_run_chain | Sends one generated id in the correlation header on every step (search your services’ logs for it); with expect echo, a service that drops the id fails its step — “the id is lost at this hop”. |
| Wait for the environment | api_wait_ready | Polls each service’s health URL until it answers (status, and e.g. UP in the body). Optionally runs your project’s own start command first — e.g. npm run start:services, or docker compose up -d if you use Docker — with its output logged to .testver/services/. Testver runs the command you give; it does not provide Docker or any other tool. |
| Run with many data sets | api_run_data_driven | Runs a request, or a folder as a chain, once per row of a CSV or JSON file; the columns become {{variables}}. An expected_status column lets a row expect a rejection (400 for a bad email). |
| Stand in for a downstream service | api_mock_start, api_mock_requests, api_mock_stop | A local mock from routes (/users/{id}, bodies that echo {{path.id}} / {{body.x}}, delays, response sequences such as 503, 503, 200 to test retries) or from an OpenAPI spec’s examples. Every call it receives is recorded, so you can check what the service under test sent. |
| Streams | api_websocket, api_sse | Connect, send, and collect messages until one matches (text, or a JSON path equal to a value), a count, or a timeout — with the transcript. |
| Events | api_event_listen, api_event_collect, api_event_publish | Kafka and RabbitMQ. Start listening before the action, then collect what was published (“an OrderCreated event with that id”). RabbitMQ is observed through a private queue bound to the exchange, so real consumers still get their messages. |
| gRPC | api_grpc | Calls a method from the service’s .proto — unary, server-streaming, client-streaming and bidi — with metadata and a deadline, over plaintext, TLS or mTLS. Without a method it lists what the proto defines. |
| Basic load | api_load_test | Fixed concurrency (≤ 200) for a time (≤ 10 min) or a request count: requests/s, latency p50/p90/p95/p99, error rate, status breakdown, and pass/fail thresholds (p95, error rate). |
Tips & Best Practices
Section titled “Tips & Best Practices”- Pick the right mode first. Web for test code, API for endpoints, Mobile for devices, Reporting for analytics. The mode shapes everything the agent can do.
- Be specific. “Fix the flaky selector in checkout.spec by switching to a data-testid locator” works better than “fix my tests.”
- Review diffs before moving on. Expand each file-diff card to confirm the agent changed what you expected.
- Use Allow, not Always allow, for write actions until you trust the pattern, you stay in control of each file change.
- Stop early. If the agent drifts, press Stop, clarify, and resend rather than letting it continue.
- Take manual control when needed. Switch the live browser to User mode for logins, captchas, or cookie banners the agent can’t handle.
- Attach context. Drop requirement docs, sample responses, or failure screenshots so the agent works from real information.
- Keep sessions tidy. Pin the ones you reuse, rename them descriptively, and delete the noise.
- End mobile sessions as soon as you’re done to avoid burning cloud device minutes.
- Mind the routing badge. Know whether actions run on the Server or your Local machine before approving them.
Troubleshooting & FAQ
Section titled “Troubleshooting & FAQ”| Symptom / Question | Answer |
|---|---|
| The model selector is empty / chat fails | No AI provider is usable. Connect your Testver account on Testver → Connections, or add a model to Ollama / LM Studio in Settings → LLM, then return to /ai. |
| A local provider is missing from the model list | It has no models yet. Add the exact model name (for Ollama, as ollama list shows it) in Settings → LLM. |
| The paperclip only uploads files | You are in Reporting mode, which takes uploaded files but not Sources. Switch to Web, Mobile or API to attach Sources. |
| The agent didn’t change a file | Check whether you clicked Deny on a permission card (the tool row shows an amber shield), or whether the request was read-only. Re-ask and Allow the edit. |
| I keep getting permission prompts | That’s by design for safety. For a tool you trust this session, click Always allow {tool} to stop being re-prompted for it. |
| No live preview appeared | The preview only shows once the agent actually launches a browser (Web mode) or you start a Mobile session. In Web mode, ask it to open the browser or navigate to a page. |
| I can’t type in the live browser | Control is set to AI. Click User in the live-view toolbar to take over, then switch back to AI. |
| The mobile provider shows “no creds” | Credentials for that cloud provider aren’t set. Click into Connectors (via Settings) and add them, then refresh the device list. |
| Start session fails or is slow | First launches can take 30 to 60 seconds. Ensure a device AND an app are selected (both are required), and that the provider has credentials. |
| My taps on the phone do nothing | A test run has claimed the device (“Test driving this session” banner). Your taps resume automatically when the run ends. |
| The browser closed unexpectedly | A “Browser session closed” notification appears. The agent may have closed it, or it timed out. Ask the agent to launch a browser again. |
| Did I lose my conversation? | No, conversations are saved as sessions. Open the History sidebar and reopen it; tool calls and diffs are restored too. |
| How do I start completely over? | Click + (New Session) for a clean chat. Deleting a session, by contrast, is permanent. |
| It refused to save a browser or environment | Your code doesn’t read that flag or doesn’t accept that value (for example -Dbrowser=edge when the driver factory only handles chrome and firefox). The reply names the reason — fix the value, or ask it to add support to the framework. |
| It saved nothing I changed in Run Configuration | As a Tester you can add new names; changes to existing entries wait in Settings → Run Configuration for an Admin to apply. |
| A suggested-mode banner keeps appearing | It’s only a soft hint based on your wording. Click Switch to … to accept or Keep … to dismiss; it never changes the mode by itself. |
Related
Section titled “Related”- API Testing with AI — the full tutorial for API mode: every kind of API test, with prompts.
- Create a Framework with AI — build a new Playwright, Cypress, Selenium, WebdriverIO, Cucumber, pytest, REST Assured or Appium framework from a prompt.
- AI Record — record clicks → script generation.
- Reports → Templates — pre-canned reporting prompts.
- Settings → LLM Providers — pick the model.