Results
Introduction
Section titled “Introduction”What is the Results screen?
Section titled “What is the Results screen?”The Results screen is where Testver stores and presents the outcome of everything it has executed. Every time you run tests — locally on your machine or in a cloud browser grid — Testver records a run: a timestamped snapshot containing each test’s status, duration, steps, errors, screenshots, videos, traces, and console output. The Results screen lets you scroll back through that history, open any run, and drill all the way down to a single failing step.
Think of it as the flight recorder for your test suite. A run is one flight; opening it is reading the black box; the per-test panel is the second-by-second cockpit transcript; and the AI Failure Analysis is the crash investigator who reads the transcript and tells you what went wrong — and sometimes patches the plane before the next flight.
Who this guide is for
Section titled “Who this guide is for”- QA engineers who need to triage failures fast, decide what is a real bug versus a flaky test, and file defects.
- Developers who want to see exactly which step failed, read the stack trace, watch the video, and have AI suggest or apply a fix.
- Test leads / managers who track pass-rate trends, set a known-good baseline, and export HTML / CSV / Excel reports for stakeholders.
- Anyone running cloud runs (BrowserStack, LambdaTest, Sauce Labs) who needs the session video, logs, and build link in one place.
Key terms (glossary)
Section titled “Key terms (glossary)”| Term | What it means in Testver |
|---|---|
| Run | One execution of one or more tests, recorded with a status, summary, duration, and per-test detail. Identified by a runId. |
| Source | Where the run executed: Local (your machine) or Cloud (a remote browser grid such as BrowserStack). |
| Baseline | A run you pin as the known-good reference point. Other runs can be compared against it to surface regressions. Only one baseline exists at a time. |
| Regression | A test that passed in the baseline but fails now — the most important signal when comparing two runs. |
| New failure | A test failing now that did not exist (or was not run) in the comparison run. |
| Fixed | A test that failed before and passes now. |
| Flaky | A test that passes and fails intermittently without code changes — one of the AI failure categories. |
| RCA (Root Cause Analysis) | The panel that pinpoints the failing step, shows the primary error, and previews the failure screenshot for a failed test. |
| Artifact | A file produced by a run: screenshot, video, or Playwright trace. Stored per test and served through Testver’s artifact API. |
| Browser matrix | The set of browsers a run executed against; shown as badges in the run detail strip and per-session in cloud runs. |
| Variant / data set | One parameterized invocation of a data-driven test (pytest params, .NET TestCase args, JUnit indices), rolled up under a single base row in the Variations card. |
| Self-Heal | An AI action that not only suggests a fix but edits your test files and re-runs the test, retrying across multiple attempts until it passes. |
| Error signature | A stable per-failure-pattern string the AI uses to remember which failures it has already fixed, surviving page refreshes and re-analysis. |
How it works
Section titled “How it works”Testver keeps a server-side run history. The Results list fetches one page of runs at a time (filtered and paginated on the server) so the initial render stays fast even with hundreds of runs. Global counts for the stat pills and filter-chip labels are computed across the whole history, not just the page you are viewing.
Within a run, each test is matched by name (and, for parameterized tests, by an index) so that history, baselines, and comparisons line up the same logical test across runs. The per-test panel additionally pulls live data from other Testver subsystems: the test’s source steps from the Test Explorer, Git blame / file history / churn for the test file, and recent pass/fail history for that test name.
Getting Started
Section titled “Getting Started”Opening the Results screen
Section titled “Opening the Results screen”- From the left navigation, click Results (the bar-chart icon). The route is
/results. - Testver loads the runs list — your run history, newest first, grouped by day.
- If a baseline has been set previously, Testver loads it on mount so the baseline marker appears on the matching run card.
The three levels
Section titled “The three levels”Results is a three-level drill-down. Each level is reflected in the URL so you can deep-link or use the browser Back button.
| Level | What you see | How you got here |
|---|---|---|
| 1. Runs list | The whole run history as cards/rows, with filters, stats, and view modes. | Default view (no runId selected). |
| 2. Run detail | One run’s summary stats, info/git/cloud strips, and the per-test list. | Click a run card (sets runId). |
| 3. Test detail panel | One test’s steps, RCA, artifacts, history, Git, variations, output, and actions. | Click a test row inside a run (sets testId). |
Screen layout
Section titled “Screen layout”| Region | Where | Contents |
|---|---|---|
| Header toolbar | Top | Title/back, status & source filter chips (list) or run label + action buttons (detail). |
| Stats strip | Below header | Aggregate pills: totals, pass rate, failed count, duration; plus cloud/browser badges in detail. |
| Info / Git strip | Detail only | Run command, cloud build name, Git branch, commit SHA + message. |
| Content area | Center, scrollable | Run cards (list), or test list / comparison / failure analysis (detail). |
| Pagination bar | Bottom (list only) | Rows-per-page selector and page navigation. |
The Runs List
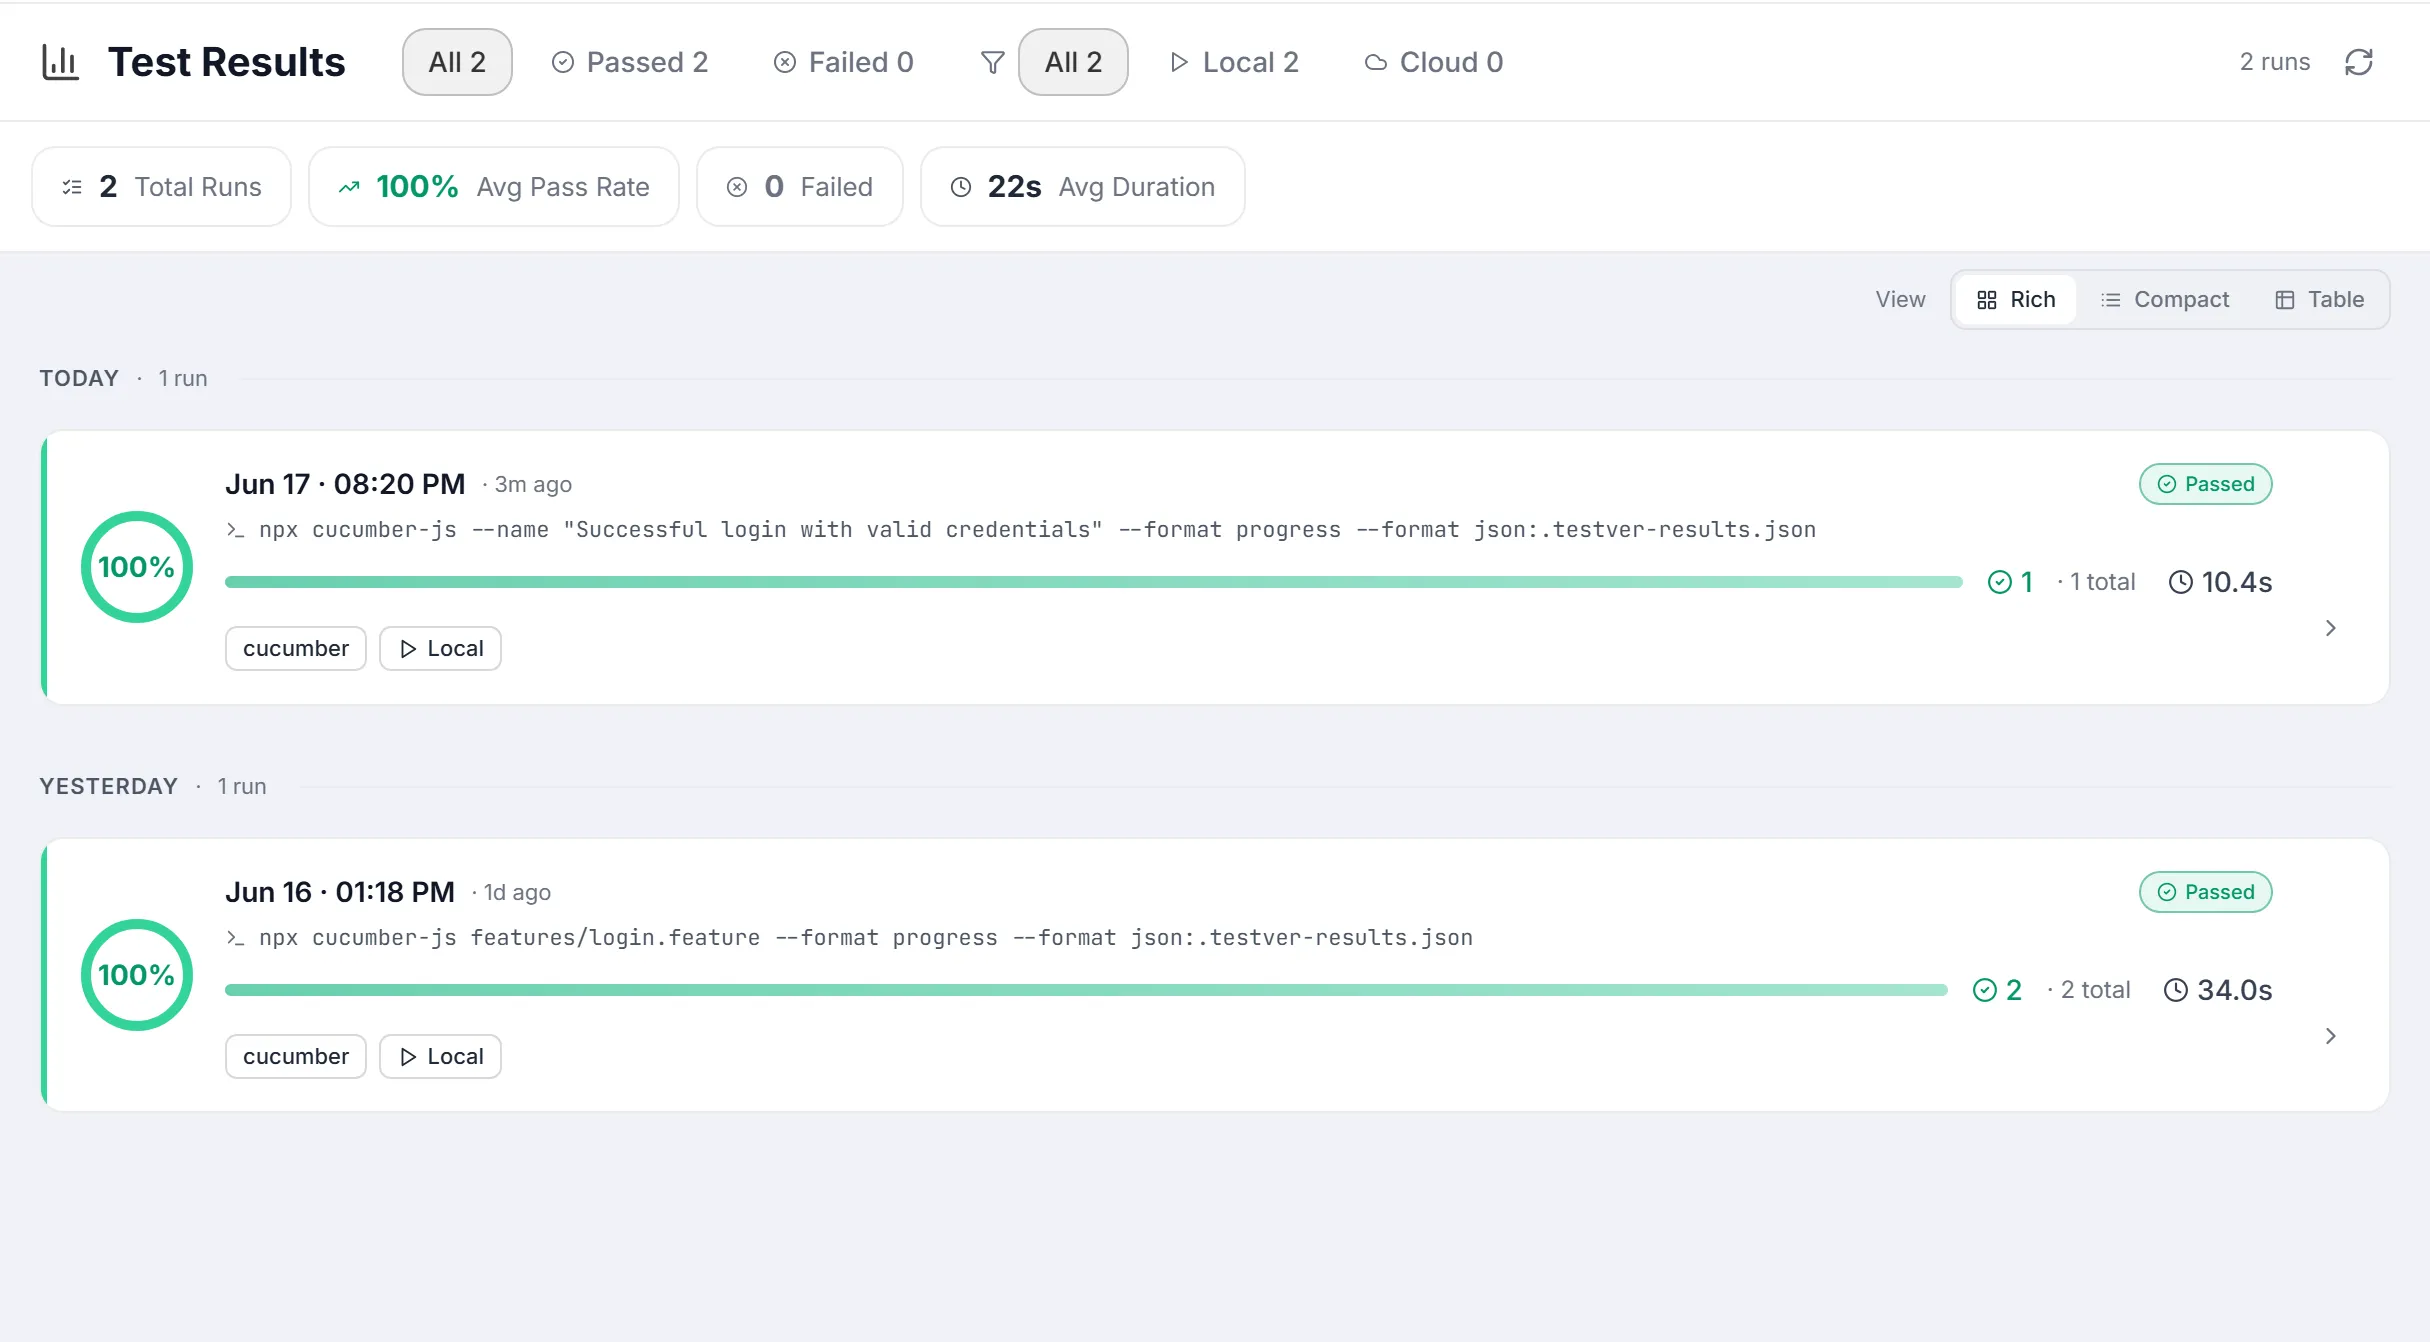
Section titled “The Runs List”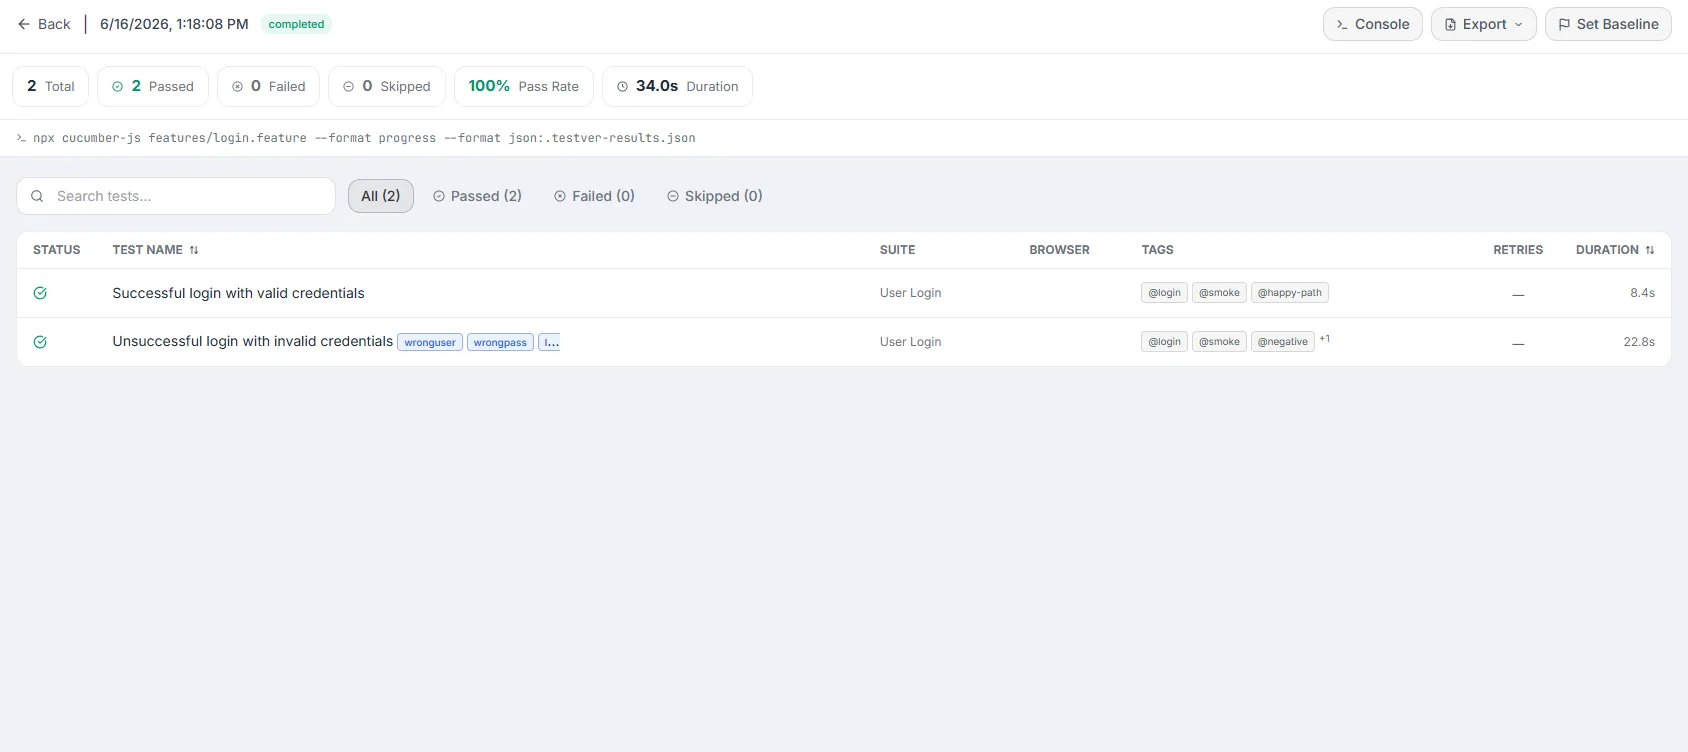
This is the default view when no run is selected. It shows your run history with filtering, summary statistics, three view modes, and per-run actions.
Status & source filters
Section titled “Status & source filters”Two rows of filter chips sit in the header. Status chips select by outcome; source chips narrow to Local or Cloud. Filtering is performed server-side across the whole history, then paginated. Each chip shows a global count so you know how many runs match before you click. Selecting any filter resets you to page 1.
| Chip | Group | Filters to | Notes |
|---|---|---|---|
| All | Status | Every run regardless of status | Default. |
| Passed | Status | Completed runs | Green check icon; counts come from the completed status total. |
| Failed | Status | Runs with failures | Red X icon. |
| Running | Status | In-progress runs | Only shown when at least one run is currently running (amber). |
| All | Source | Local + Cloud | Default. |
| Local | Source | Runs on your machine | Play icon. |
| Cloud | Source | Runs on a remote grid | Cloud icon (blue). |
Summary stats strip
Section titled “Summary stats strip”Four pills summarize the whole filtered history (not just the current page):
| Pill | Shows | Color logic |
|---|---|---|
| Total Runs | Count of runs in scope | Neutral. |
| Avg Pass Rate | Average pass rate % | Green ≥ 90%, amber ≥ 70%, red below; gray dash when no runs. |
| Failed | Number of failed runs | Red when > 0, gray otherwise. |
| Avg Duration | Average run duration in seconds | Neutral; dash when no data. |
View modes
Section titled “View modes”A View selector (in the list header inside the scroll area) toggles how each run is rendered. Your choice is remembered in the browser (localStorage key testver:results:viewMode) so it persists across visits.
| Mode | Density | Best for |
|---|---|---|
| Rich | Full cards with stats and visual emphasis | Default — scanning recent runs at a glance. |
| Compact | Condensed cards | Seeing more runs per screen. |
| Table | Tabular rows | Dense scanning and column-style comparison. |
The run card
Section titled “The run card”Each run is represented by a card (or row). Cards are grouped under sticky day headers. A card carries the run’s label or start time, its status, pass-rate / counts, source, and the controls below. Clicking the body of a card opens its run detail (sets runId, clears any testId).
Baseline
Section titled “Baseline”Pin any run as the baseline — your known-good reference. The baseline card is visually marked, and only one baseline exists at a time. Setting a baseline on a run that is already the baseline clears it.
- On a run card, use the Set Baseline control (or the row ⋯ menu).
- Testver stores the baseline server-side and marks that card.
- To remove it, trigger Set Baseline again on the same run — it toggles off.
Selecting & comparing runs
Section titled “Selecting & comparing runs”From the list you can pick two runs to compare. When you choose a pair, Testver opens one as the current run (via the URL runId) and stashes the other as the compare target; the run-detail view then renders the Run Comparison panel automatically.
The row ⋯ menu
Section titled “The row ⋯ menu”Each card exposes a per-run actions menu for the run-scoped operations (such as setting/clearing the baseline and initiating a compare) without first opening the run.
Pagination
Section titled “Pagination”The bottom bar appears whenever there is at least one run. It is server-side pagination — Testver fetches a single page at a time.
| Control | Behavior |
|---|---|
| Rows per page | Choose 10, 20 (default), 50, 100, or 200. Changing it resets to page 1. |
| Showing X–Y of N | The current slice of the filtered total. |
| « / ‹ Prev / Next › / » | First, previous, next, and last page; disabled at the ends. |
| Page A of B | Current page indicator. |
The Run Detail View
Section titled “The Run Detail View”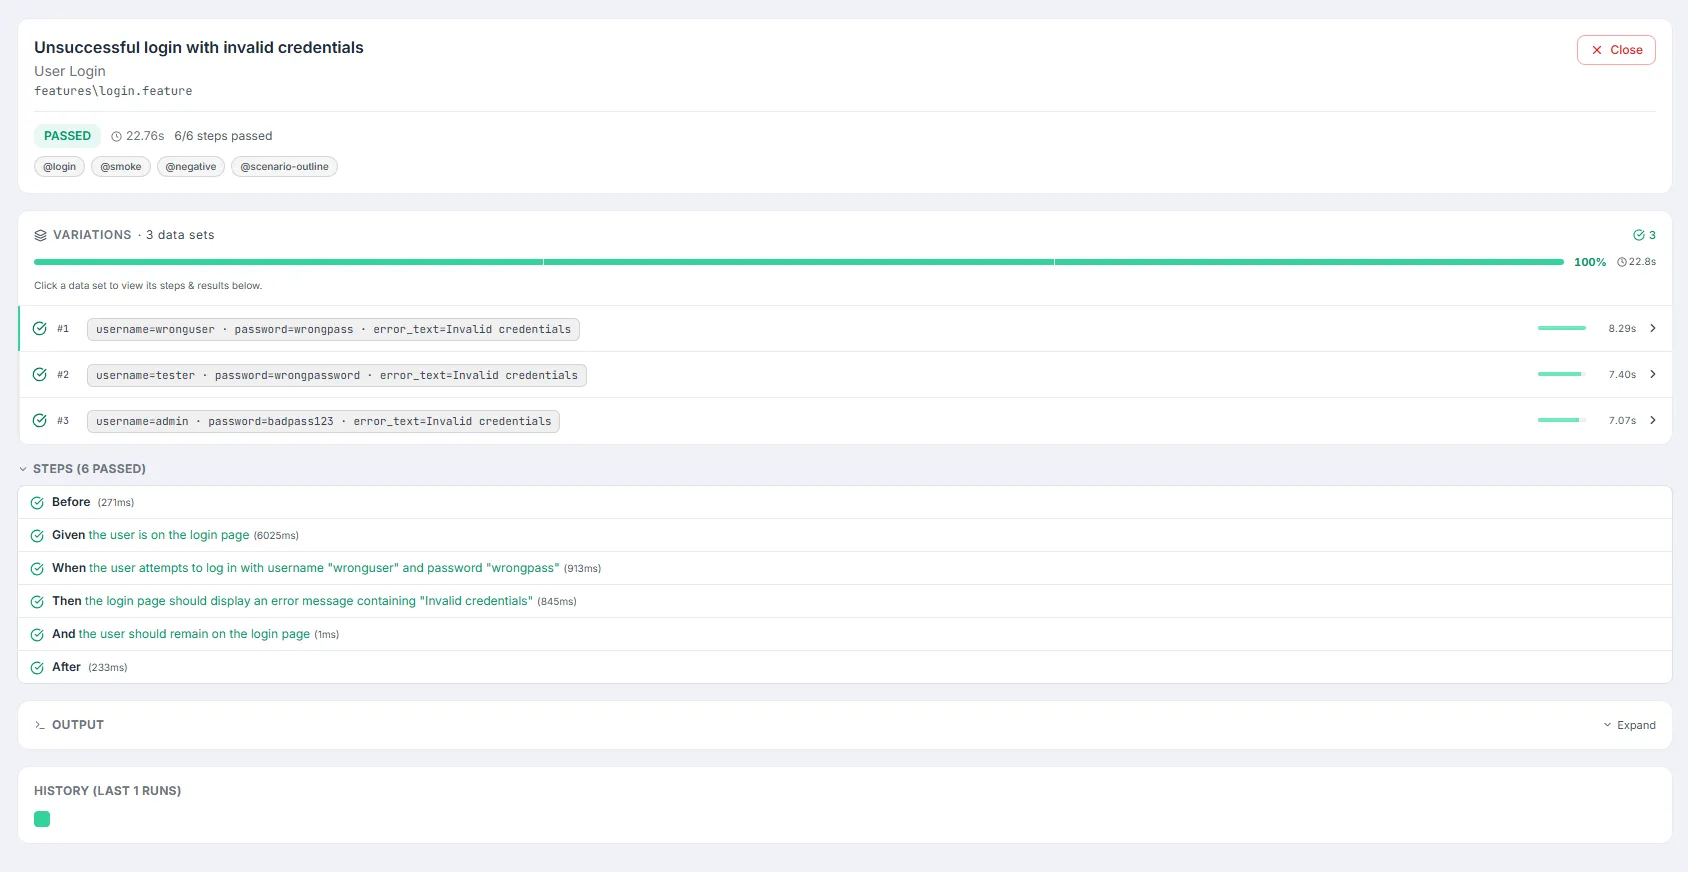
Clicking a run opens its detail view: a header with run-scoped actions, a stats strip, info/git/cloud strips, and the per-test list (or, when toggled, the comparison or failure-analysis panels).
Summary stats strip
Section titled “Summary stats strip”Pills summarize this single run. Total, Passed, Failed, Skipped, Pass Rate, and (when available) Duration. Pass Rate is color-coded the same way as the list (green/amber/red). After these pills, badges appear:
- A Cloud badge (e.g.
BS,LT,SL) when the run executed on a cloud provider. - One browser badge per distinct browser the run’s tests used, each with the browser’s icon.
Info / Git / cloud-session strips
Section titled “Info / Git / cloud-session strips”When present, a slim info strip shows the run command (monospace, with a terminal icon), the cloud build name, the Git branch, and the commit SHA with its message. Separately, a Git Commit Correlation banner can appear in amber when Testver determines, with medium/high confidence, that new failures were likely introduced by a specific commit — it names the failure count, the short SHA, and the author, with a confidence tag.
For cloud runs that returned artifacts, a Cloud Session card lists each session with its browser, OS/version, status, and duration, plus a View Build link and per-session Video, Logs, and Session buttons. Videos open in an in-app modal (proxied URLs get the auth token appended; public CDN URLs play directly).
The per-test list
Section titled “The per-test list”The center of the run detail is the test results table — one row per test. It supports search and status filtering and shows the key columns below. Clicking a row opens the Test Detail Panel (sets testId).
| Column | Shows |
|---|---|
| Status | Passed / Failed / Skipped indicator. |
| Test name | The (formatted) test/scenario name. |
| Suite / File | Grouping and source file where available. |
| Browser | Browser the test ran on, with its icon. |
| Duration | How long the test took. |
| Retries | Retry count when greater than zero. |
Run-detail toolbar actions
Section titled “Run-detail toolbar actions”| Action | What it does | When shown |
|---|---|---|
| Console | Opens a full-screen modal with the run’s console output (ANSI-colored, with byte size, Copy, and close). | Always; toast if output is unavailable. |
| Export ▾ | Dropdown to download HTML Report, CSV, or Excel (XLSX) for the run (opens in a new tab). | Always. |
| Set Baseline | Pins this run as baseline, or clears it if it already is (label shows Baseline ✓). | Always; toast confirms. |
| vs Baseline | Opens the Run Comparison panel comparing this run against the current baseline. | Only when a baseline exists and differs from this run. |
| Fetch Artifacts | Pulls videos/logs/screenshots from the cloud provider for this run. | Cloud runs that don’t yet have artifacts. |
| Analyze Failures | Toggles the AI Failure Analysis panel (and back to Show Tests). | Only when the run has at least one failed/errored test. |
The Test Detail Panel
Section titled “The Test Detail Panel”Clicking a test opens a full-width panel with everything Testver knows about that single test. Sections render only when relevant data exists. When a test is data-driven, a Variations card lets you switch the whole panel to a single data set (master-detail).
Header & status
Section titled “Header & status”The header card shows the test name, its suite and file path (monospace), and — when Git data is available — who last modified the file, when, and the short commit SHA. A Close button returns you to the run’s test list. Below, a badges row shows the status (PASS/FAIL/etc.), duration, retries (when > 0), the browser, a passed/total steps count, the worker index, and assertion count where present. Tags, @annotations, and parameters appear as chips (parameters are hidden for rolled-up parameterized tests, since the Variations card shows each data set instead).
A collapsible Steps list shows each step with its keyword, name, optional duration, and a status icon. The header summarizes (N passed, M failed, K skipped). For BDD/Cucumber tests the native steps are used; for code-based tests Testver overlays execution status onto the same human-readable steps the Test Explorer shows — locating the failing step via the stack trace, marking earlier steps passed and later steps skipped. Background steps are tagged [BG], hooks [Hook]. A step’s embedded data table renders inline, and failed steps expose a Show error details toggle.
| Icon | Step status | Meaning |
|---|---|---|
| Green check | passed | Step executed successfully. |
| Red X | failed | Step where the test failed. |
| Gray minus | skipped | Not run (often after a failure). |
| Amber dot | pending | Step pending / not implemented. |
| Gray question | undefined | No matching definition / unknown status. |
RCA & stack trace
Section titled “RCA & stack trace”For a failed test, a red Root Cause Analysis card names the failing step, notes how many subsequent steps were skipped because of it, and shows the primary error in a scrollable code block. A Copy button copies the error (and stack trace) to the clipboard. If a failure screenshot exists, an inline preview appears — click it to open the full-screen viewer. A separate, collapsible Stack Trace card shows the full trace in monospace; a scenario-level error (when there is no specific failing step) renders in its own Error card.
Artifacts (screenshot / video / trace)
Section titled “Artifacts (screenshot / video / trace)”When the test produced artifacts, an Artifacts card offers:
| Button | Action |
|---|---|
| Screenshot | Opens the Screenshot Viewer modal (zoom 25%–300% with +/− controls, click backdrop to close). |
| Video | Opens an in-app video player modal (autoplay, controls). |
| Trace | Downloads the Playwright trace file. |
| Trace Viewer | Opens the trace in the public Playwright Trace Viewer with the artifact URL pre-loaded. |
A separate Open Trace Viewer link with a download icon also appears near the top when a trace path is present.
Retry timeline
Section titled “Retry timeline”When a test was retried (more than one attempt), a Retry Timeline shows a row of numbered circles — green for passed attempts, red for failed — connected by arrows, with a hover tooltip giving each attempt’s status, duration, and a snippet of its error. A caption reports the total attempts and the final status.
Coverage
Section titled “Coverage”If the run captured coverage for the test, a Coverage card shows four metrics — lines, branches, functions, statements — each as a percentage with a colored bar (green ≥ 80%, amber ≥ 60%, red below).
History
Section titled “History”A History (last N runs) card shows up to the last 20 outcomes for this test name as a strip of small squares — green passed, red failed, gray other — most recent on the right, each with a date tooltip. Useful for spotting flakiness at a glance.
A Git History card lists the most recent commits that touched the test file (short SHA, message, relative time). If the file has high churn (changed many times in a short span), an amber warning notes how many edits over how many days — a heuristic for fragile, frequently-broken tests.
The Variations master-detail (data-driven tests)
Section titled “The Variations master-detail (data-driven tests)”When a test is parameterized, Testver rolls every invocation into one base row and shows a Variations card: a header with the data-set count, pass/fail/skip tallies, a per-variant distribution bar, an overall pass-rate %, and total duration. Each variant row shows a status icon, an index, the data-set label (shown verbatim as a single id — never split), a relative duration bar, and a chevron.
- Open the parameterized test to reveal the Variations card.
- Click any data set row. An indigo Viewing data set banner appears at the top of the panel.
- All detail sections below — Steps, RCA, Stack Trace, Artifacts, Output — now render that specific variant’s execution detail.
- Click Back to summary (in the banner) or click the same row again to return to the rolled-up view.
Output
Section titled “Output”An Output card lets you expand the captured console/stdout. At the summary level it lazily fetches the run console scoped to this test (with a possible note explaining scope), rendered with ANSI colors and a Copy button. With a variant selected, it shows that variant’s systemOutput instead, or a hint to return to summary when none was captured.
Create Defect / AI Fix
Section titled “Create Defect / AI Fix”For a failed test, two actions appear at the bottom:
- Create Defect — files a defect in Test Management titled
[FAIL] <test name>, pre-filled with suite, file, browser, duration, retries, the error, a step-by-step reproduction (with pass/fail icons), the error message, and the stack trace. The reporter is the signed-in user. If a defect already exists for this test, the button is replaced by a status chip showing the defect id and its current state (open / in progress / resolved). - AI Fix Suggestion — shown when the test has an error message; surfaces an AI-driven suggestion path for the failure. (The full AI Fix and Self-Heal workflow lives in the Failure Analysis panel — see Section 6.)
Comparing Runs & AI Failure Analysis
Section titled “Comparing Runs & AI Failure Analysis”Run Comparison
Section titled “Run Comparison”Opened via vs Baseline (or by selecting two runs in the list), the Run Comparison panel diffs two runs. It headers with the two run labels (Baseline vs Current when comparing against the baseline). A pass-rate summary shows both runs’ pass rates side by side with a delta and a trend arrow (green up / red down / gray flat).
Four summary cards count the categories, each expandable to list the affected tests (Regressions is expanded by default). A Duration Changes section lists tests whose run time shifted, with before/after and a percent change (red slower, green faster). If nothing meaningful differs, an empty-state message is shown.
| Category | Definition | Color |
|---|---|---|
| Regressions | Passed in baseline, fails now — the highest-priority signal. | Red |
| New Failures | Failing now, not previously failing/run. | Amber |
| Fixed | Failed before, passes now. | Green |
| New Passes | Newly passing tests. | Cyan |
| Duration Changes | Tests with a notable runtime delta. | Amber section |
AI Failure Analysis
Section titled “AI Failure Analysis”Click Analyze Failures to open the AI panel. Testver groups the run’s failures by error pattern and assigns each group a category, a count of affected tests, and a suggested explanation. Each group is expandable; the first group is open by default. Git ownership data (who likely owns the failing area) is shown where available.
| Category | Label | Icon |
|---|---|---|
| bug | Application Bug | Red bug — a genuine product defect. |
| environment | Environment Issue | Sky cloud — infra/config/network, not the test. |
| flaky | Flaky Test | Amber triangle — intermittent, non-deterministic. |
| test-issue | Test Code Issue | Orange wrench — the test itself is wrong/outdated. |
| timeout | Timeout | Purple clock — exceeded a wait/timeout. |
| unknown | Needs Investigation | Gray question — could not be confidently categorized. |
AI Fix & Self-Heal
Section titled “AI Fix & Self-Heal”Each failure group offers two AI actions, both confirmed before they start:
- AI Fix — a read-only analysis: the AI reads relevant files and streams a markdown explanation with a suggested fix. A Tool Activity log shows each tool the AI runs (read, search, etc.) live. Nothing on disk changes.
- Self-Heal & Fix Test — the AI implements the fix and re-runs the test, retrying across attempts (
Attempt N of M) until it passes or gives up. Live file diffs are shown per changed file, and the header reflects a PASS/FAIL verdict. You may add per-group instructions in the textarea (e.g. “only fix the selector, don’t touch the assertion”) and can Stop mid-flow.
Export menu (Failure Analysis)
Section titled “Export menu (Failure Analysis)”The Failure Analysis panel has its own export menu to save the analysis as CSV, Excel, or HTML — useful for sharing triage results outside Testver.
Common Tasks (How Do I…?)
Section titled “Common Tasks (How Do I…?)”| I want to… | Do this |
|---|---|
| See only failed runs | Click the Failed status chip in the runs list header. |
| See only cloud runs | Click the Cloud source chip. |
| Open a run | Click its card / row in the list. |
| Open a specific test’s detail | Open the run, then click the test row in the per-test list. |
| Mark a known-good run | Use Set Baseline on the card (or in run detail). |
| See what regressed since the baseline | Open the run and click vs Baseline (or select two runs to compare). |
| Read the failing step and error | Open the test; see the Root Cause Analysis and Steps sections. |
| Watch the failure video | In the test panel Artifacts card, click Video (or use the cloud session Video button). |
| Open a Playwright trace | In Artifacts, click Trace Viewer (or Trace to download). |
| See a data-driven test’s individual cases | Click a row in the Variations card; use Back to summary to exit. |
| File a bug from a failure | In the failed test panel, click Create Defect. |
| Get AI to explain a failure | Run Analyze Failures, then AI Fix on a group. |
| Let AI fix and re-run the test | In Failure Analysis, click Self-Heal & Fix Test and approve the actions. |
| Export a run report | In run detail, use Export ▾ → HTML / CSV / Excel. |
| See the raw console output | Click Console in run detail, or expand Output in the test panel. |
Tips & Best Practices
Section titled “Tips & Best Practices”- Set a baseline early. Comparisons are only as useful as the reference; pin a green run you trust and update it when your suite legitimately changes.
- Triage by category. In Failure Analysis, fix Application Bug and Test Code Issue groups first; treat Flaky as stabilization work and Environment as infra follow-up.
- Use the History strip in the test panel to tell a one-off failure from a chronically flaky test before you spend time on it.
- Watch for the Git correlation banner — when it points a finger at a commit with high confidence, start your investigation there.
- Always review Self-Heal diffs before accepting; the AI edits real files. Add explicit instructions to keep changes scoped.
- Pick the right view mode — Table for dense scanning, Rich for daily monitoring; the choice is remembered.
- Bump Rows per page to 50–100 when bulk-scanning history; remember filters and pages reset together.
Troubleshooting & FAQ
Section titled “Troubleshooting & FAQ”| Symptom | Likely cause / fix |
|---|---|
| ”Console output not available” toast | That run did not capture console output, or it has been cleaned up. Per-test Output may still be available. |
| No video/logs on a cloud run | Artifacts haven’t been pulled yet — click Fetch Artifacts in the run-detail toolbar (shown for cloud runs without artifacts). |
| Cloud video won’t play in the modal | Use the Open in new tab ↗ escape hatch — the embedded player may hit CORS, an expired signature, or a codec issue. |
| Analyze Failures button is missing | The run has no failed/errored tests, so there is nothing to analyze. |
| AI Fix says it failed / ‘configure an LLM provider’ | No LLM provider key is set. Configure a provider (e.g. set an API key) and retry. |
| A group shows ‘already fixed’ / ‘Fixed by AI’ | The AI previously self-healed that error signature; the marker is stored in your browser and survives refresh and re-analysis. |
| Steps list is empty / ‘Loading test steps…’ | Testver is resolving the test’s source steps from the Explorer; it appears once they load. Tests with no detectable steps show none. |
| Parameters chips missing on a data-driven test | Intentional — they would show only one variant’s data. Use the Variations card to see each data set. |
| Baseline marker disappeared | Setting baseline on the current baseline run toggles it off; re-set it on the run you want. |
| Filtered list looks empty | A status + source combination may have zero matches; use Clear filters (or click All on both rows). |
| Defect button replaced by a status chip | A defect already exists for this test — the chip shows its id and state instead of letting you create a duplicate. |
Related
Section titled “Related”- Runner — kick off runs.
- Test Explorer — browse the test catalog the runs executed.
- Output — file-tree view of all run artifacts.
- Defects — file defects from failures.