

Code Map
Introduction
Section titled “Introduction”What is the Code Map?
Section titled “What is the Code Map?”The Code Map screen is Testver’s structural index of your automation codebase. When you open it, Testver scans every source file in the project, extracts each method (and step definition, page object, helper, fixture, and test), and works out how they connect: which tests reach which methods, which methods call which, and which methods nothing reaches at all. The result is presented as four interlocking views — Inventory, Quality, Graph, and Steps — backed by a detail drawer, AI assists, and an export.
The screen has two top-level tabs:
| Tab | What it maps |
|---|---|
| Methods & Steps | Your automation code — the four views described above. This is where Code Map opens. |
| Test Data | Your test data — the spreadsheets, CSVs, JSON fixtures, and property files your tests read, and which tests read them. |
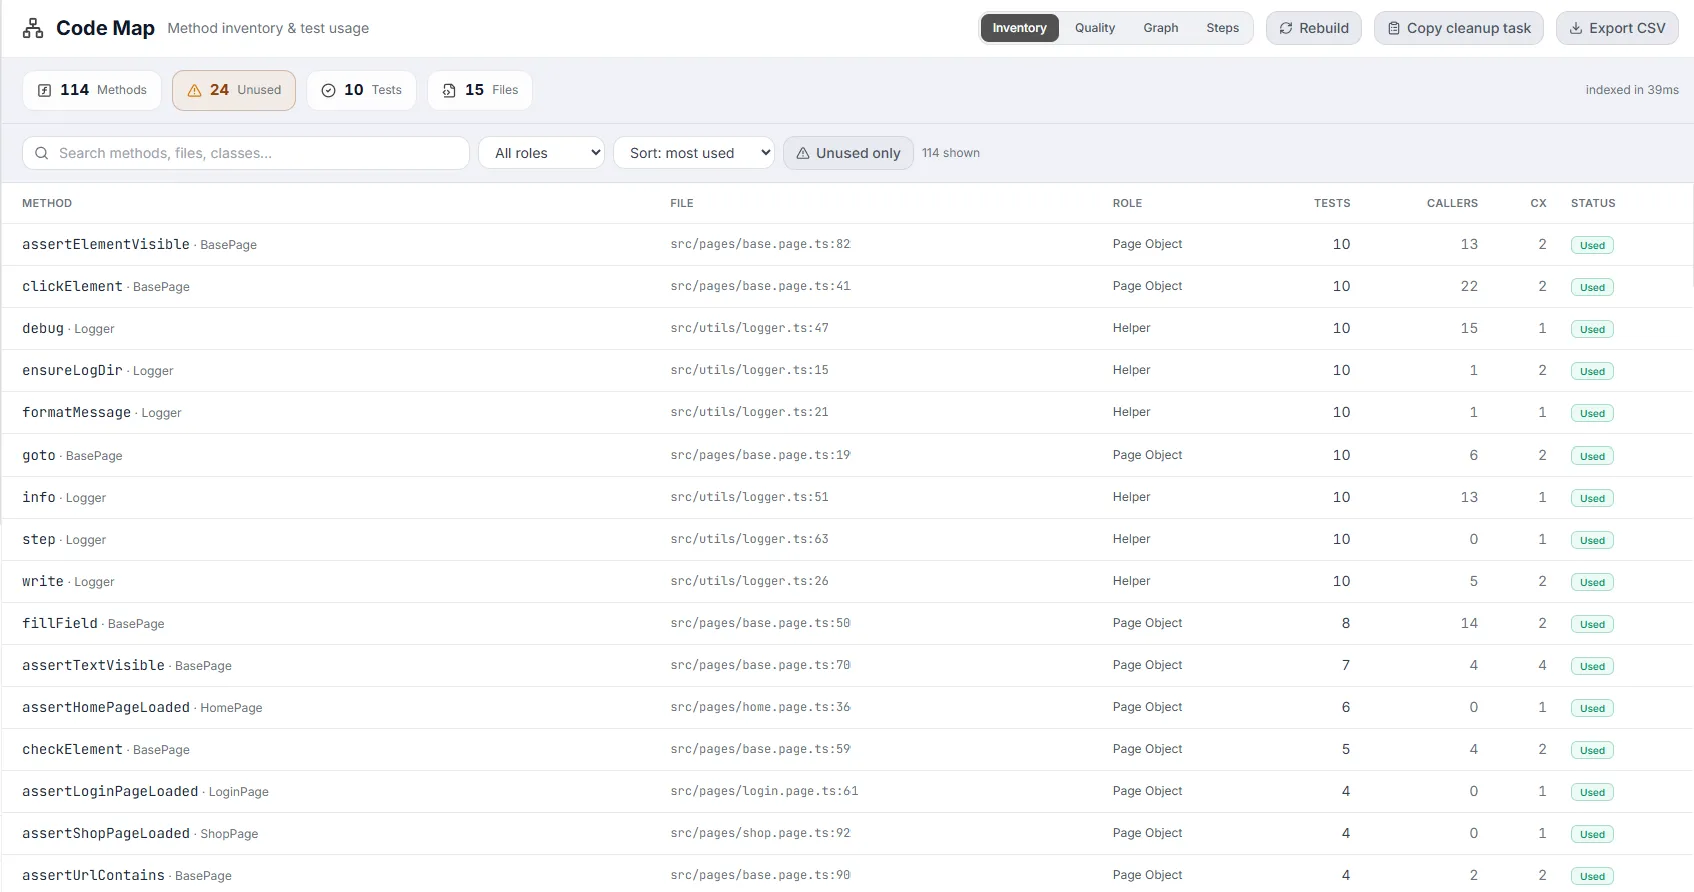
Think of it as an X-ray of your codebase. From the outside a test suite looks like a stack of green checkmarks; the Code Map lets you see through that surface to the skeleton underneath — the load-bearing helpers every test leans on, the orphaned page objects nobody calls anymore, the over-grown methods that are hard to maintain, and the duplicate code that drifts out of sync. Nothing here changes your project; it only reveals what is already there.
Who this guide is for
Section titled “Who this guide is for”- QA automation engineers who want to find dead code, trim unused page-object methods, and keep a framework lean.
- SDETs / framework owners auditing test architecture — which helpers are over-used, which files are unmaintainable, where duplication is creeping in.
- Tech leads & reviewers who need a fast, file-by-file health read before a refactor or a release.
- BDD / Cucumber teams who want to see step-definition usage, undefined steps, ambiguous matches, and duplicate definitions in one place (the Steps view).
- Anyone onboarding to an unfamiliar automation repo who wants a map before diving into individual files.
Key terms (glossary)
Section titled “Key terms (glossary)”These terms appear throughout the screen, in column headers, drawer tags, and quality hints. Skim this table once and the rest of the guide reads easily.
| Term | What it means in the Code Map |
|---|---|
| Method | A single function/method extracted from a source file — the basic unit of the Inventory. Each has a name, optional class, file, line, role, language, visibility, LOC, and complexity. |
| Role | How Testver classifies the method’s purpose: Page Object, Helper, Support, Step Def, Fixture, Test, or Source. Shown in the Role column and as a tag in the drawer; used by the role filter. |
| Page object | A method belonging to a page-object class — the UI-interaction layer (locators + actions) that tests drive through. Role label page. |
| Helper | A reusable utility/support method (role helper or support) called by tests or other methods rather than driving the UI directly. |
| Step def (step definition) | A Cucumber/Gherkin step implementation — the code bound to a Given/When/Then pattern. Role step; explored in depth in the Steps view. |
| Dependency / call | A directed relationship between two methods: A calls B. The drawer lists both Calls (what this method invokes) and Called by methods (its callers). |
| Used by tests | The number of distinct tests whose execution path reaches this method (directly or transitively). Shown in the Tests column and as the default sort. |
| Unused | A method that no test reaches and nothing calls — a candidate for removal, flagged with an amber Unused badge. Static analysis only; see the warning below. |
| Confirmed dead | A method that is statically unused AND was never executed at runtime according to imported coverage data. Stronger signal than “unused”. Only available when coverage is present. |
| Cyclomatic complexity (Cx) | A count of independent paths through a method — roughly, how many branches/decisions it contains. Higher = harder to test and maintain. Shown in the Cx column; color-coded amber at ≥ 6, red at ≥ 10. |
| Orphan file | A source file in which every automation method is unused — a whole-file dead-code candidate (Quality view). |
| Orphan locator | An element/selector definition that is referenced nowhere else in the project (Quality view). Best-effort detection — verify before removing. |
| Entry point | A method Testver treats as a root of the call graph (e.g. a test). Entry-point tests are filtered out of the Inventory list to keep it focused on reusable code. |
| Maintainability score / grade | A heuristic 0–100 score (with an A–F grade) per file, combining complexity, size, unused count, and duplication. Lower = needs attention. |
Supported languages & frameworks
Section titled “Supported languages & frameworks”The Code Map is language-aware: each method carries its detected language, and the source viewer and complexity heuristics adapt accordingly. Coverage of the analysis includes:
- JavaScript / TypeScript automation (Playwright, WebdriverIO, Cypress-style frameworks, plain JS/TS test code).
- Python test code (the highlighter and comment rules switch to
#-style line comments for Python/Ruby). - Java, C# and other C-family languages with classes, visibility modifiers, and
////* */comments. - BDD / Gherkin (Cucumber) — features, scenarios, tags, and step definitions; the Steps tab appears only when Gherkin is detected in the project.
- Page-object, helper, support, and fixture patterns common to UI automation, classified automatically into roles.
How the analysis works
Section titled “How the analysis works”- Zero-config — there is nothing to set up. Open the screen and Testver indexes the project automatically; the header shows the method, unused, test, and file counts as soon as it finishes.
- Fast & local — indexing runs against your local project files. The stats row reports the elapsed time (e.g. “indexed in 420ms”), so you can see how quick it is.
- Cached & incremental — results are cached. Re-opening the screen reuses the existing index; you only pay the full cost again when you press Rebuild (a forced re-scan).
- Read-only & safe — the Code Map never modifies your code. Every action (browsing, exporting, even AI assists) only reads. The drawer states explicitly that AI suggestions change nothing in your project.
- Coverage-aware (optional) — if runtime coverage data is available, the Code Map merges it in to upgrade “unused” candidates to Confirmed dead and shows per-method run-status tags.
The two tabs
Section titled “The two tabs”Each tab has its own guide:
| Tab | Guide | What it maps |
|---|---|---|
| Methods & Steps | Methods & Steps tab | Your automation code — Inventory, Quality, Graph, and Steps views. Code Map opens here. |
| Test Data | Test Data tab | The spreadsheets, CSVs, JSON fixtures, and property files your tests read. |
Switch with the tab bar at the top. The active tab is kept in the URL (/code-map?view=data), so it survives a refresh and can be bookmarked.
Common Tasks (How Do I…?)
Section titled “Common Tasks (How Do I…?)”| I want to… | Do this |
|---|---|
| Find dead code to delete | Inventory → toggle Unused only (or Confirmed dead with coverage). Or open Quality → Orphan files for whole-file candidates. |
| Hand a cleanup list to a teammate or AI | Header → Copy cleanup task — a Markdown checklist of unused methods lands on your clipboard. |
| See which tests use a method | Click the method in Inventory → read the Used by tests section in the drawer. |
| Trace what a method calls / who calls it | Open the drawer’s Calls and Called by methods sections, or switch to Graph and focus the method. |
| Understand an unfamiliar method | Open its drawer → AI assists → Explain (or read the Source block). |
| Find the most fragile / complex code | Quality → Most complex methods and File maintainability (lowest scores first). |
| Find duplicated logic | Quality → Duplicate & near-duplicate methods, then Suggest consolidation. |
| Check BDD step health | Steps → Quality toggle (undefined, ambiguous, duplicate steps, tags). |
| Find unused step definitions | Steps → toggle Unused only. |
| Export the inventory for a report | Header → Export CSV (Steps view has its own CSV export). |
| Refresh after editing code | Header → Rebuild. |
Tips & Best Practices
Section titled “Tips & Best Practices”- Treat every flag as a candidate. Unused/dead/orphan findings are static guesses — verify against reflection, dynamic dispatch, and runtime wiring before deleting.
- Prefer Confirmed dead over Unused when coverage is available — a method that is both statically unused and never ran at runtime is a much safer removal.
- Rebuild after edits. The index is cached; counts won’t update until you press Rebuild.
- Start cleanup at the bottom of the maintainability list — the lowest-scoring files and modules give the biggest return.
- Use the Graph to sanity-check before deleting — focus a method and confirm nothing meaningful flows into it.
- Configure an AI provider in Settings to unlock Explain / Document / Safe-to-delete / Generate-test / consolidation suggestions; all of them are read-only.
- Links open in new tabs — file and test links keep the Code Map open so you don’t lose your place.
- Combine filters (search + role + sort + unused) to drill straight to the rows you care about.
Troubleshooting & FAQ
Section titled “Troubleshooting & FAQ”The Steps tab is missing. It only appears for Gherkin/BDD projects. If your project has no Cucumber features, the tab is hidden by design.
A method I know is used shows as Unused. Static analysis can’t see reflection, dynamic dispatch, or string-based invocation. Confirm with the Graph and your own knowledge before removing — the Code Map labels these as candidates for that reason.
There’s no Confirmed-dead chip or filter. Those appear only when runtime coverage data is available to Testver. Without coverage you still get the statically-derived Unused signal.
An AI assist returns “(no response … check that an AI provider is configured in Settings)”. No AI provider is set up. Configure one in Settings to enable Explain, Document, verdicts, test/step suggestions, and consolidation.
Counts look stale after I changed code. The index is cached — press Rebuild to force a fresh scan.
Export failed. An error toast describes the cause. Retry, and ensure your browser allows the download.
The graph says “graph truncated (large neighborhood)”. The focus method has too many connections to draw fully. Focus a more specific method, or read its relationships in the drawer instead.
The table says “No methods match your filters.” Your search/role/unused filters exclude everything — clear the search or reset the filters.
Are AI suggestions applied to my code? No. The drawer states it explicitly: AI suggestions are read-only and nothing in your project is changed. The same goes for browsing and exporting.