

Traceability Matrix Tab
The Traceability Matrix Tab of the Coverage screen.
This tab maps the full chain Source Document -> Content Sections -> Test Cases. A view toggle at the top-right switches between Detailed View (document-grouped, the default) and List (one row per requirement).
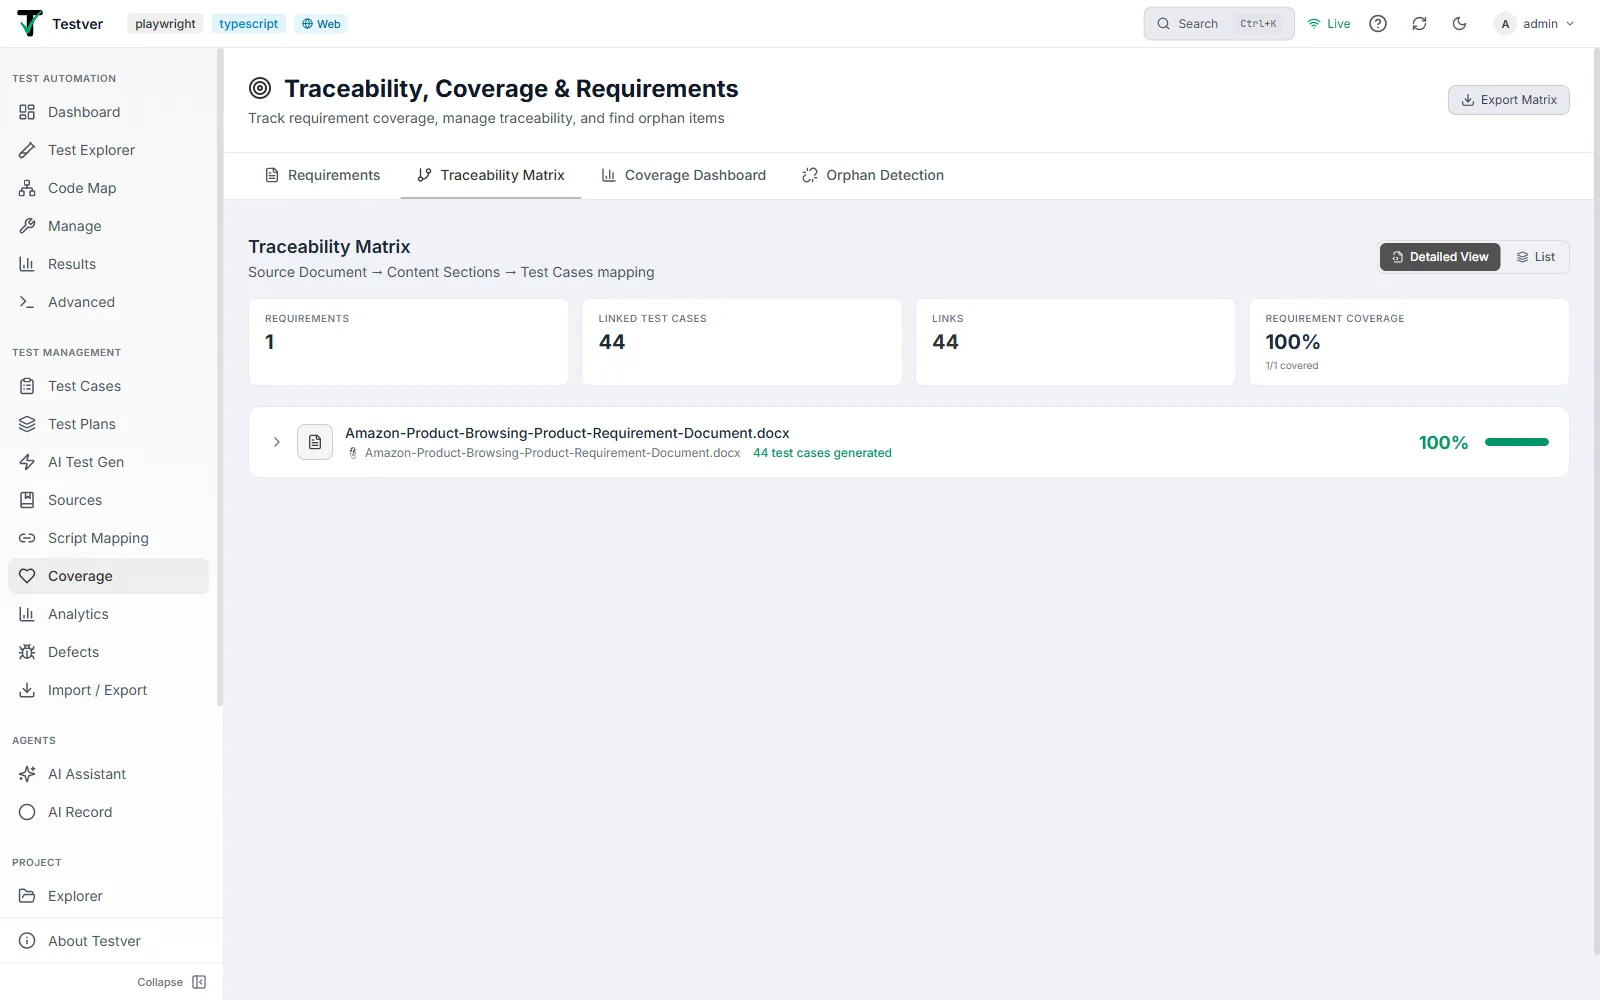
Reading the summary cards
Section titled “Reading the summary cards”| Card | Meaning |
|---|---|
| Requirements | Number of requirements in the matrix. |
| Test Cases | Number of distinct test cases referenced across all requirements. |
| Links | Total requirement<->test-case links (shown in brand color). |
| Matrix Fill | Links divided by total possible cells (requirements x test cases), as a percent. A density figure — low is normal and not necessarily bad. |
Detailed View
Section titled “Detailed View”Detailed View lists each source document as a collapsible card. The card header shows the source title, file name, count of generated test cases, any manually-linked count (amber), and a coverage percent with a colored progress bar:
| Coverage % | Color |
|---|---|
| 80% and above | Green (emerald) |
| 50% to 79% | Amber |
| Below 50% | Red |
Expanding a source card renders the Requirement x Strategy heatmap (the DocumentRequirementMatrix). Rows are requirements; columns are test-design strategies, abbreviated in the header — HP happy-path, NEG negative, BND boundary, EQ equivalence, ERR error-handling, SEC security, PRF performance, A11Y accessibility, CMP compatibility, INT integration, DV data-validation. Hover a column header for the full name.
| Cell appearance | Meaning |
|---|---|
| Green checkmark + a number | That requirement has that many test cases for this strategy. |
| Dim hollow circle | No tests for this strategy on this requirement (a gap). |
| Per-row score % | Covered strategies divided by strategies seen for the source — a per-requirement coverage score. |
| Last Gen column | Relative time since the requirement’s tests were last generated (e.g. “3h ago”). |
| Tests column | Total test cases for that requirement row. |
Heatmap controls (above the table): a Search box (matches requirement title, source quote, requirement id, or test-case titles); a sort dropdown (Recently generated / Least covered first / Highest priority first / Most tests first / Fewest tests first); an Uncovered only checkbox (shows only requirements that have at least one strategy with zero tests); Per-persona columns checkbox (adds one column per persona, only offered when the source has persona data); Priority filter chips (Critical/High/Medium/Low); and Persona filter chips. A “Showing X of Y requirements” line and a Clear filters link round it out.
Drill-down. Click any row label (the chevron) to expand it inline. The expansion shows one card per strategy listing every test case (id, title, priority badge, persona badge); each test links to /test-cases?tcId=<id>. A special amber Manually Linked row appears at the bottom when the source has test cases attached by hand from the Requirements tab — those carry no strategy/persona metadata, so their taxonomy columns read “(no taxonomy data)”.
List View
Section titled “List View”List View flattens everything to one row per requirement with these columns: Requirement (priority badge + title + id), Linked Test Cases (color-coded chips), Count, Result, and Coverage. A legend at the top decodes the chip colors.
| Signal | Color | Meaning |
|---|---|---|
| Test-case chip / Passed | Green (emerald) | Latest execution of that test passed (shown with a check). |
| Test-case chip / Failed | Red | Latest execution failed (shown with an X). |
| Test-case chip / Not Run | Gray | Never executed (shown with a dot). |
| Row tint — green | Emerald wash | Requirement is Fully Covered (has tests and all passed). |
| Row tint — red | Red wash | Requirement has no test cases linked (a hard gap). |
| Coverage badge | Green / Amber / Red | Fully Covered / Partially Covered / Not Covered. |
The Result column rolls the linked tests into one verdict: Failed if any linked test failed, Passed only if every linked test passed (and there is at least one), otherwise Not Run. Coverage is none when no tests are linked, full when the rolled-up result is Passed, and partial otherwise.
Related
Section titled “Related”- Coverage overview — the screen and its tabs.