

Methods & Steps tab
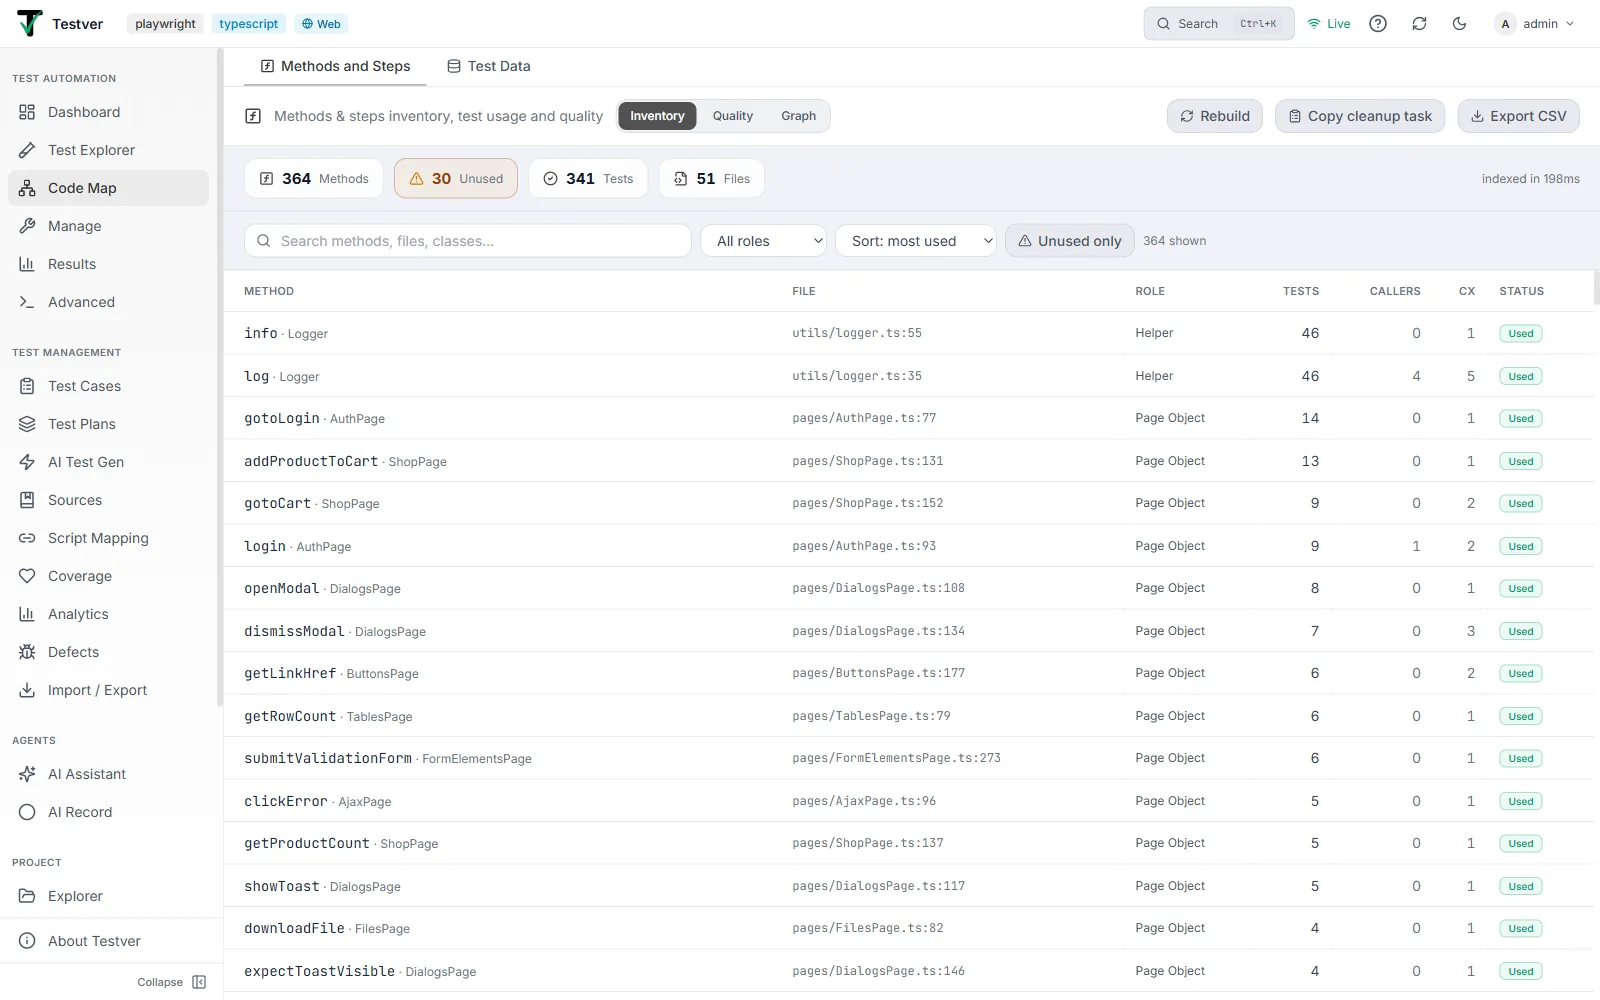
The Methods & Steps tab is where the Code Map opens. It indexes every method in your automation codebase and presents it through four views — Inventory, Quality, Graph, and Steps.
Getting Started
Section titled “Getting Started”Opening the Code Map
Section titled “Opening the Code Map”- In the left navigation, open Code Map under Test Automation (route
/code-map). The header shows a network icon, the title Code Map, and the subtitle “Method inventory & test usage”. - The screen opens on the Methods & Steps tab. Switch to Test Data with the tab bar at the top; the active tab is kept in the URL (
/code-map?view=data), so it survives a refresh and can be bookmarked. - On first load you’ll see “Indexing project…” with a spinner while Testver scans your files. This is the initial build.
- When indexing finishes, the stats row appears (Methods, Unused, Tests, Files, optional Confirmed-dead, and the index time), and the Inventory view loads with the full method table.
- You can also arrive here via a deep link from elsewhere — e.g. “Open in Code Map” from the Test Explorer passes
?symbol=<id>(optionally&name=<n>), which lands you on the Inventory view with that method’s drawer already open and the search pre-filled.
Screen layout
Section titled “Screen layout”| Area | Location | What it does |
|---|---|---|
| Top tab bar | Very top | Methods & Steps and Test Data — the screen’s two halves. Everything below applies to the Methods & Steps tab. |
| Header bar | Below the tabs | Title and subtitle on the left; the view toggle (Inventory / Quality / Graph / Steps) in the middle-right; and the global action buttons Rebuild, Copy cleanup task, Export CSV on the right. |
| Stats row | Below the header | At-a-glance counts: Methods, Unused, Tests, Files, an optional Confirmed-dead chip, and the index duration. Hidden until the index is ready. |
| Toolbar | Below the stats (Inventory & Steps only) | Search box, role/sort dropdowns, and filter toggles (Unused only, optional Confirmed dead), plus a “N shown” counter. |
| Main list / canvas | Center, scrollable | The active view’s content: the Inventory table, the Quality sections, the Graph canvas, or the Steps table/quality. |
| Detail drawer | Right side, slides in | Opens when you click a method (Inventory) or a step (Steps). Shows file link, tags, AI assists, relationships, and source. Width ~540px (max 48% of the viewport). |
The four views (Methods & Steps tab)
Section titled “The four views (Methods & Steps tab)”Inside the Methods & Steps tab, a segmented toggle switches between four views of the same index:
- Inventory — the searchable, sortable table of every method with its role, test usage, callers, complexity, and status. Your starting point.
- Quality — health insights: module overview, duplicate clusters, complex methods, orphan files, tests without assertions, orphan locators, and file maintainability.
- Graph — an interactive call-graph centered on a chosen “focus” method, showing the tests, callers, the focus, and its callees as colored nodes.
- Steps — BDD/Gherkin only. A step-definition inventory plus a quality sub-view (undefined, ambiguous, duplicate steps, and tags). This tab is hidden entirely unless Gherkin is detected.
Reading the stats row
Section titled “Reading the stats row”| Badge | Meaning |
|---|---|
| Methods | Total number of indexed methods (the size of the inventory). |
| Unused (amber) | How many methods are statically unused — no test reaches them and nothing calls them. Removal candidates. |
| Tests | Number of tests discovered in the project. |
| Files | Number of source files indexed. |
| Confirmed dead (emerald, optional) | Shown only when coverage data is available. The count of methods that are both statically unused and never executed at runtime, annotated with the coverage format. The chip’s tooltip names the coverage source. |
| indexed in …ms (right-aligned) | How long the most recent index took — a quick performance read. |
Header & Global Controls
Section titled “Header & Global Controls”These four controls sit in the header and apply across the whole screen (the view toggle) or to the underlying index/data (the action buttons).
Rebuild
Section titled “Rebuild”Forces a fresh re-index of the project, bypassing the cache. Use it after you’ve edited code and want the map to reflect the new state. While it runs, the button shows a spinner and is disabled; when it finishes, the views reload with the new data.
Copy cleanup task
Section titled “Copy cleanup task”Builds a Markdown checklist of every unused method, grouped by file, and copies it to your clipboard — ideal for pasting into a ticket, a PR description, or an AI coding assistant. Each entry is a checkbox with the class-qualified method name and its line number.
- If coverage is available, methods that are also never executed at runtime are annotated — confirmed dead (not covered at runtime).
- The list ends with a reminder: Candidates only — verify before deleting (static analysis can miss reflection / dynamic dispatch).
- A success toast confirms how many methods were copied. If there are no unused methods, you’ll see “No unused methods to clean up.”
Export CSV
Section titled “Export CSV”Downloads the inventory as a CSV file for spreadsheets, audits, or reporting. The Steps view has its own separate Export CSV button that exports the step-definition data instead. If an export fails, an error toast explains why.
View toggle
Section titled “View toggle”The segmented control that switches between Inventory, Quality, Graph, and Steps. The active view is highlighted. The Steps segment is only present for Gherkin/BDD projects — if no Gherkin is detected, it simply doesn’t appear.
Inventory View
Section titled “Inventory View”The default view: a single sortable, filterable table of every reusable method in the project. Entry-point tests are excluded so the list stays focused on the code your tests use.
The toolbar
Section titled “The toolbar”| Control | How to use it |
|---|---|
| Search box | Type to filter by method name, file path, or class name (case-insensitive, matches any of the three). Placeholder: “Search methods, files, classes…”. |
| Role dropdown | ”All roles” by default, or pick a single role (Page Object, Helper, Support, Step Def, Fixture, Test, Source) to narrow the list. Only roles actually present in the project appear. |
| Sort dropdown | Sort: most used (by test count, default), most callers (by caller count), name (A–Z), or file (by path, then line). |
| Unused only (toggle) | When on (amber), shows only methods flagged unused — your dead-code shortlist. |
| Confirmed dead (toggle, optional) | Appears only with coverage. When on (red), narrows further to methods that are unused and never ran at runtime. Tooltip: “Statically unused AND never executed at runtime”. |
| N shown counter | A live count of how many rows pass the current filters. |
The columns
Section titled “The columns”| Column | Meaning |
|---|---|
| Method | The method name (monospace), with its class shown after a · separator when present. |
| File | The file path and start line (file:line), truncated with a tooltip showing the full path. |
| Role | The classified role label (Page Object, Helper, Step Def, etc.). |
| Tests | How many tests reach this method — the usage signal. Higher numbers mark load-bearing code. |
| Callers | How many other methods call this one. |
| Cx | Cyclomatic complexity. Colored gray normally, amber at ≥ 6, red at ≥ 10. Header tooltip: “Cyclomatic complexity”. |
| Status | Used (emerald) when tests reach it; Unused (amber) when nothing does; Indirect (gray) when no test reaches it directly but it isn’t flagged unused. |
Opening a method
Section titled “Opening a method”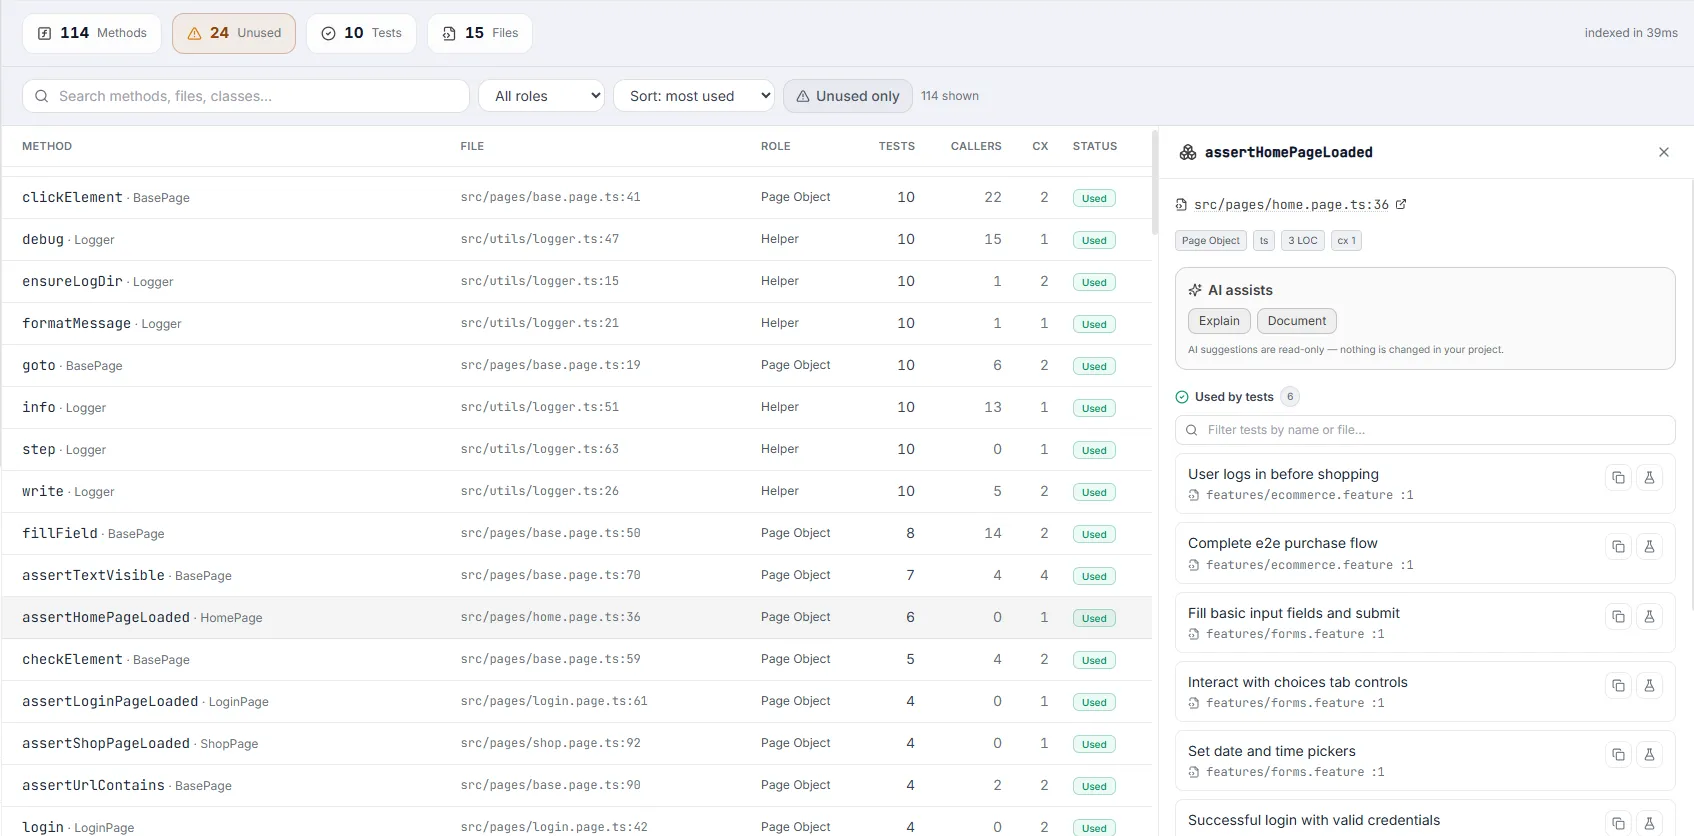
- Click any row in the table. The row highlights and the Method Details drawer slides in from the right.
- Click another row to switch the drawer to that method; the new selection highlights instead.
- Close the drawer with the X in its header (or by clicking away within the screen’s flow).
- If your filters exclude everything, you’ll see “No methods match your filters.” with a search icon — clear or loosen the filters to bring rows back.
Method Details Drawer
Section titled “Method Details Drawer”The right-hand drawer is where you investigate one method in depth. It loads on demand (showing “Loading…” briefly) and is organized into the sections below.
Header & file link
Section titled “Header & file link”The drawer header shows a box icon and the method name (monospace). Below it, a clickable file link — file:line with a file-code icon and an external-link icon — opens the method in the Project Explorer in a new browser tab, so the Code Map stays open and undistracted.
A row of small tags summarizes the method’s metadata at a glance:
- Role (e.g. Page Object, Helper), the language, and visibility (public/private/etc., when known).
- LOC (lines of code) and cx (cyclomatic complexity).
- Unused candidate (amber) when the method is flagged unused.
- With coverage: ran at runtime (emerald) or not covered at runtime (red) — the runtime execution status for this specific method.
AI assists
Section titled “AI assists”A highlighted panel offers one-click AI helpers. Results stream into a copyable block below the buttons. The first two are always available; the last two appear only for unused methods.
| Button | What it produces |
|---|---|
| Explain | A plain-language explanation of what the method does. |
| Document | A suggested documentation comment (doc-string) for the method. |
| Safe to delete? (unused only) | An AI verdict on whether the unused method is safe to remove, including a confidence percentage and reasoning. |
| Generate test (unused only) | A suggested test that would exercise the method, so it stops being unused if you’d rather keep it. |
- While a request runs, the button area shows a spinner and the label (e.g. “Explanation…”).
- Each result has its own Copy button (with a “Copied” confirmation).
- The panel footer states: AI suggestions are read-only — nothing is changed in your project.
Used by tests
Section titled “Used by tests”Lists every test that reaches this method. Each entry (a TestCard) shows the formatted test name and a file link (file:line) that opens the file in the Project Explorer (new tab). Two icon buttons sit on the right: Copy test name (with a check confirmation) and Open in Test Explorer (a flask icon, new tab). When the list has more than four entries, an inline filter box appears — “Filter tests by name or file…”.
Called by / Calls
Section titled “Called by / Calls”Two relationship sections map the method’s place in the call graph:
- Called by methods — the method’s callers. Each row shows the (class-qualified) name and file; clicking opens it in the Project Explorer (new tab).
- Calls — the methods this one invokes, in the same row format.
- Each section shows a count badge, and both gain an inline filter box once they exceed four entries (“Filter methods by name or file…” / “Filter calls by name or file…”).
Source
Section titled “Source”The method’s source code, rendered in a theme-aware, syntax-highlighted block with a faux “traffic-light” title bar showing the language. A Copy button copies the raw source (with a “Copied” confirmation). If the source can’t be loaded, it shows “(source unavailable)”.
Quality View
Section titled “Quality View”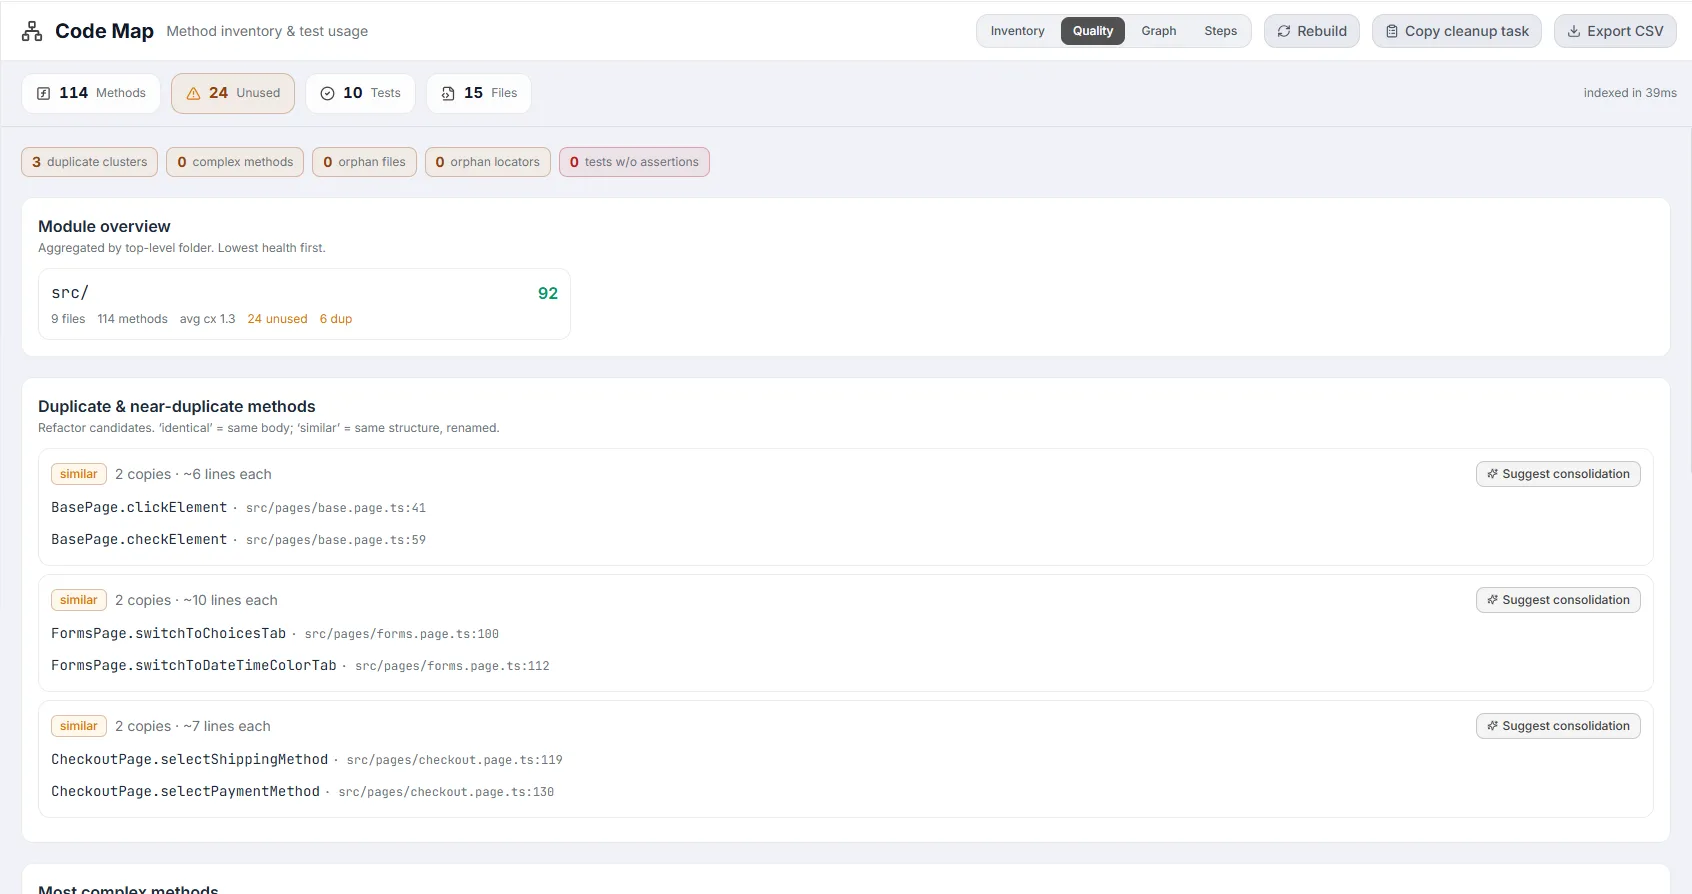
The Quality view turns the index into actionable health insights. It opens with a row of summary chips — duplicate clusters, complex methods, orphan files, orphan locators (all amber), and tests w/o assertions (red) — then a stack of detailed sections. Each section header carries a one-line hint explaining what it flags.
Module overview
Section titled “Module overview”A grid of cards, one per top-level folder, aggregating maintainability across that module — sorted lowest health first so trouble spots surface at the top. Each card shows the folder name, a 0–100 score (colored emerald ≥ 80, amber ≥ 70, orange ≥ 60, else red), plus file count, method count, average complexity, and — when non-zero — unused and duplicate counts. How to act: start refactoring with the lowest-scoring modules.
Duplicate & near-duplicate methods
Section titled “Duplicate & near-duplicate methods”Clusters of methods with identical or similar bodies. Each cluster shows a kind badge — identical (red, same body) or similar (amber, same structure with renames) — the number of copies and approximate lines each, and a list of the member methods (click to open in the drawer). A Suggest consolidation AI button proposes how to merge them into one. How to act: extract the shared logic into a single helper. Hint shown: “Refactor candidates. ‘identical’ = same body; ‘similar’ = same structure, renamed.”
Most complex methods
Section titled “Most complex methods”A table of the highest-complexity methods, each row showing the method (clickable to the drawer), its cx (amber), max nesting depth, and LOC. How to act: break large branchy methods into smaller pieces and add focused tests. Hint: “High cyclomatic complexity / deep nesting / long bodies.”
Orphan files
Section titled “Orphan files”Files in which every automation method is unused — whole-file dead-code candidates. Each row shows the file (amber file icon), is clickable to open in the Project Explorer (new tab), and notes how many unused methods it contains. How to act: confirm nothing references the file dynamically, then consider deleting it. Hint: “Every automation method in the file is unused — whole-file dead-code candidates.”
Tests without assertions
Section titled “Tests without assertions”Tests where Testver detected no expect/assert — they may pass without actually verifying anything. Each entry shows the test name and file:line. How to act: review each and add the missing assertion (or confirm the verification happens elsewhere). Hint: “Tests with no detected expect/assert — possible gaps.”
Orphan locators
Section titled “Orphan locators”Element/selector definitions referenced nowhere else — unused locators. Each row shows the locator name and file:line and opens in the Project Explorer (new tab). How to act: verify, then remove. Hint warns it’s “best-effort — verify before removing.”
File maintainability
Section titled “File maintainability”A ranked table (up to 40 files, lowest first) scoring each file on complexity, size, unused count, and duplication. Columns: File (clickable to the Explorer), Methods, Avg cx, Unused, and Score · Grade (A–F, color-coded from emerald for A down to red for F). How to act: target the bottom of the list for cleanup. Hint: “Heuristic score (complexity, size, unused, duplication). Lowest first.”
Graph View
Section titled “Graph View”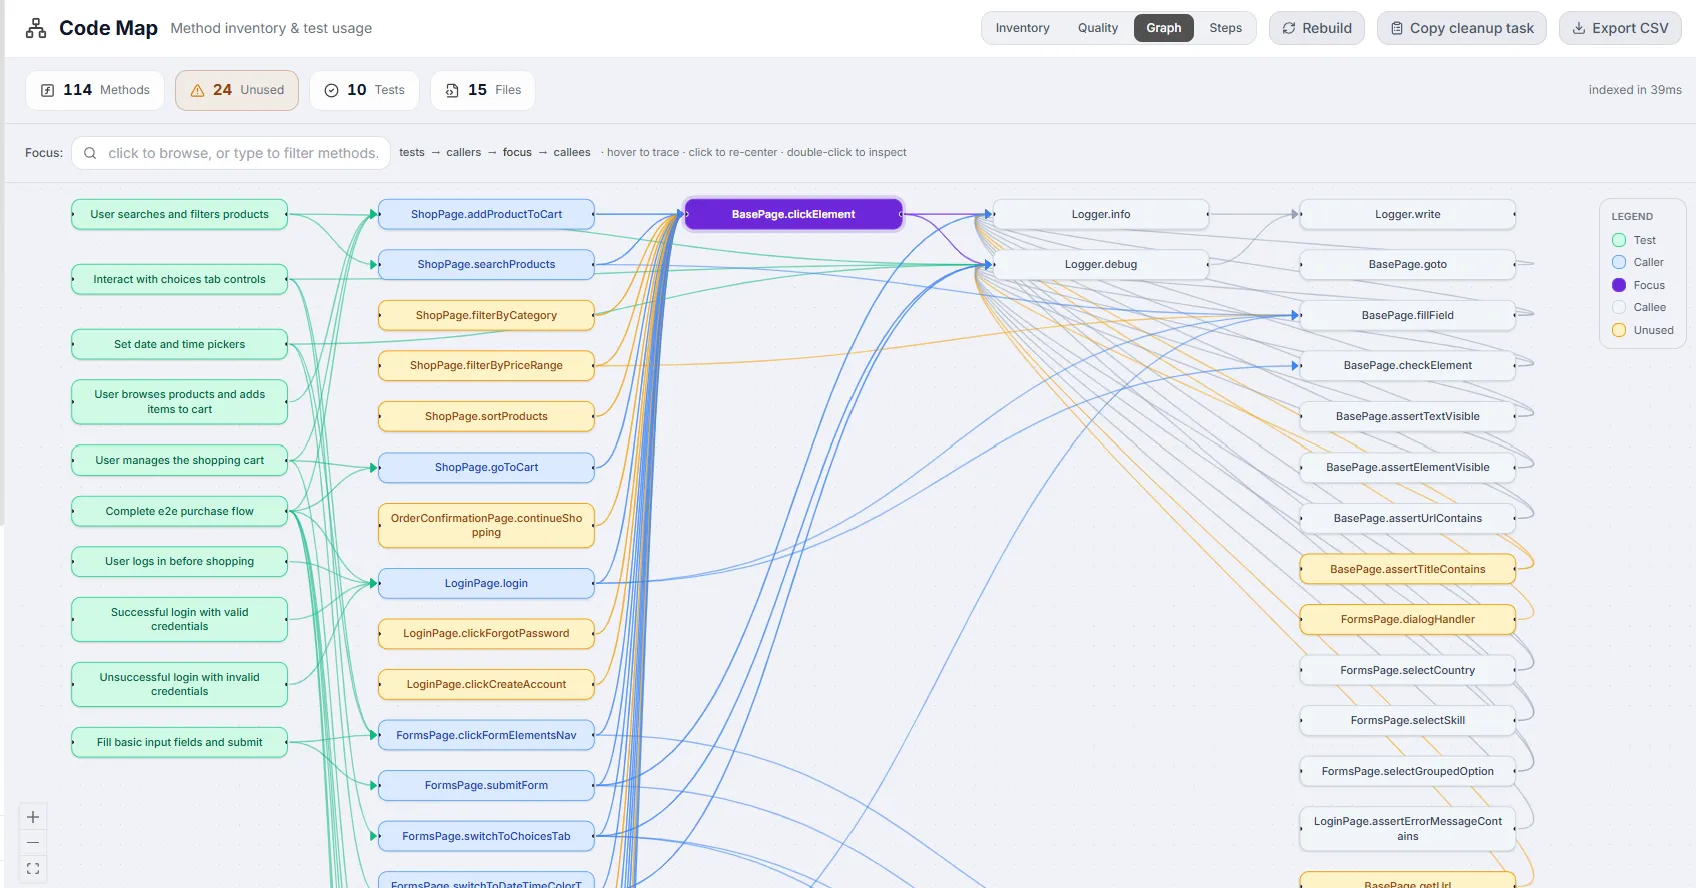
An interactive call graph centered on a chosen focus method. It lays nodes out in columns — tests on the far left, then callers, the focus, its callees, and deeper dependencies — with arrows showing the direction of calls. On open it auto-selects the most-connected method as the focus so the canvas is never empty.
Focus search
Section titled “Focus search”Top-left is a Focus search box (“click to browse, or type to filter methods…”). Click it to browse all methods (most-connected first); type to filter by name or class. Pick a method from the dropdown to re-center the graph on it. The dropdown header tells you whether you’re seeing matches or the full “All methods · most connected first” list (capped at 60).
Node columns
Section titled “Node columns”Reading left to right, the columns are: tests → callers → focus → callees. A header strip restates this flow alongside the interaction hint “hover to trace · click to re-center · double-click to inspect”. If the focus method has a very large neighborhood, an amber “graph truncated (large neighborhood)” notice appears.
Legend
Section titled “Legend”A legend panel (top-right) maps node colors to categories:
| Node color | Category | Meaning |
|---|---|---|
| Green | Test | A test that reaches the focus method. |
| Blue | Caller | A method that calls (leads into) the focus. |
| Purple (solid) | Focus | The currently centered method. |
| Gray | Callee | A method the focus calls. |
| Amber | Unused | A node flagged unused. |
Hover, click & double-click
Section titled “Hover, click & double-click”- Hover a node to spotlight it and its neighbors — unrelated nodes dim and the connecting edges brighten/animate, tracing that method’s connections.
- Click a (non-test) node to make it the new focus and re-center the graph on it.
- Double-click a (non-test) node to open it in the Inventory drawer (the Method Details).
- Nodes can be dragged to tidy the layout; test nodes are not clickable as a focus.
Pan & zoom
Section titled “Pan & zoom”Standard graph navigation: drag the empty canvas to pan, scroll to zoom, and use the on-canvas Controls (zoom in/out, fit-view). The graph auto-fits whenever a new focus loads. Colors adapt automatically to light/dark theme.
Steps View (BDD)
Section titled “Steps View (BDD)”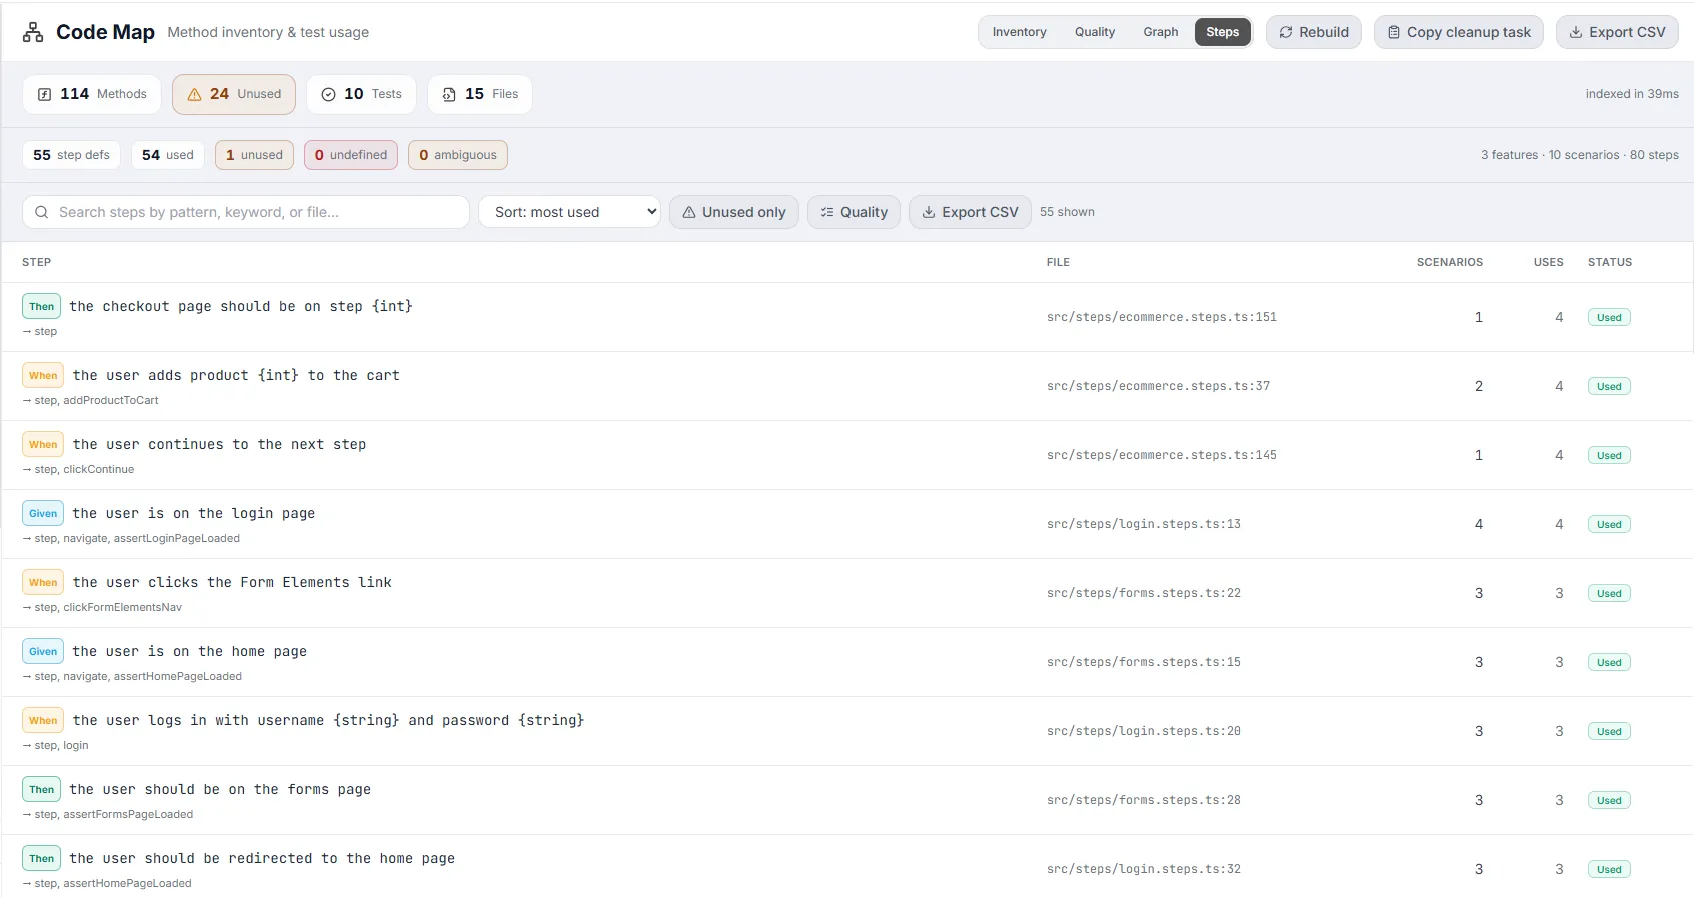
Available only for Gherkin/Cucumber projects. It inventories every step definition and — via a Quality toggle — surfaces BDD-specific problems. If no Gherkin is detected you’ll see “No Gherkin scenarios detected in this project.”
A stat row across the top shows: step defs, used, unused (amber), undefined (red), and ambiguous (amber), plus a right-aligned summary of features · scenarios · steps. Its own toolbar offers a search box (“Search steps by pattern, keyword, or file…”), a sort dropdown (most used / most scenarios / keyword / pattern / file), an Unused only toggle, a Quality toggle, and an Export CSV button.
The step table
Section titled “The step table”Each row shows the step — a colored keyword badge (Given=sky, When=amber, Then=emerald, And/But=violet, Step=gray) plus the pattern, and below it the methods the step reaches (”→ …”). Other columns: File (file:line), Scenarios (how many use it), Uses (total usages), and Status (Used / Unused). Click a row to open the Step drawer.
The Step drawer mirrors the method drawer: a file link, tags (scenario count, use count, and “Unused — no scenario uses this” when applicable), an Explain this step AI button, a filterable Used by scenarios list (each opening in the Test Explorer, with feature name and scenario tags), a Reaches methods list (each opening that method in the Inventory drawer), and the Step definition source block.
Quality sub-view
Section titled “Quality sub-view”Toggle Quality to swap the step table for BDD health sections (the search/sort/unused controls disable while it’s open):
- Undefined steps — Gherkin steps with no matching definition (they fail at runtime as “step undefined”). Each shows the step text, how many times it occurs, the affected scenarios (clickable to the Test Explorer), and a Suggest definition AI button that proposes step-definition code.
- Ambiguous steps — steps matching more than one definition (Cucumber raises an “ambiguous” error). Each lists the conflicting definitions with their files/lines.
- Duplicate step definitions — the same pattern defined more than once. Each shows the members and a Consolidate AI button that suggests merging them.
- Tags — every scenario tag and how many scenarios carry it (shown only when tags exist).
Related
Section titled “Related”- Code Map overview — the screen and its two tabs.
- Test Data tab — the data half of the Code Map.
- Test Explorer — open any test this index references.