

Dashboard tab
The Dashboard tab of the Script Mapping screen (/script-mapping?tab=dashboard) turns your mappings into reportable numbers. It is where Script Mapping opens.
What the tab shows
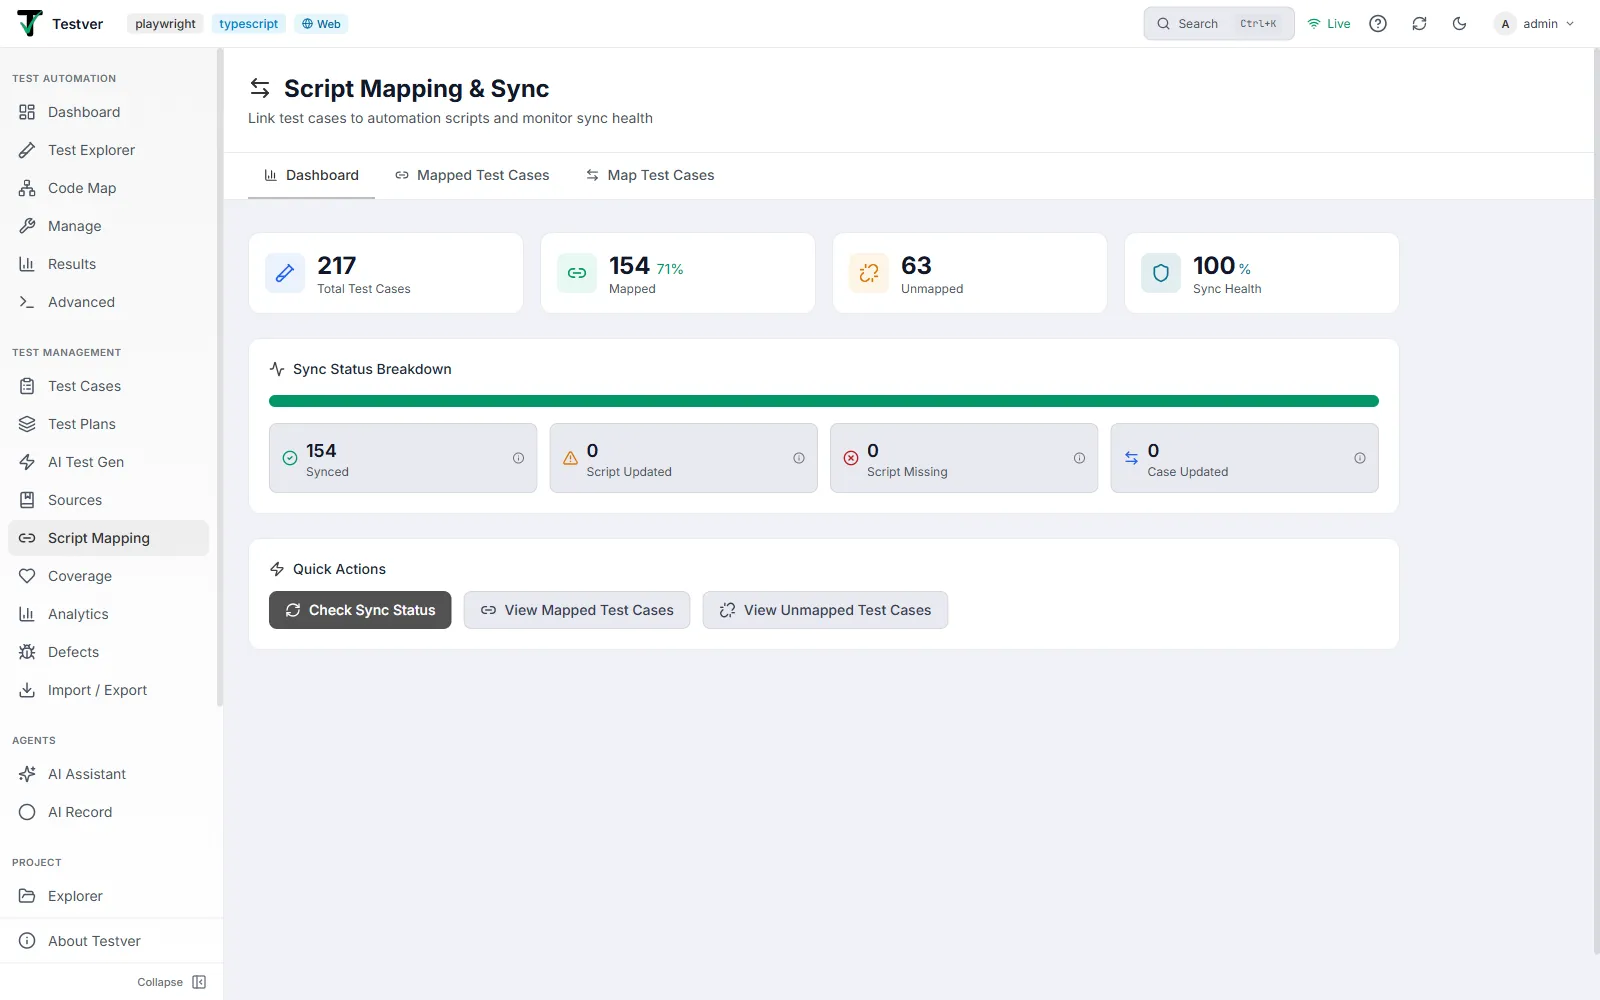
Section titled “What the tab shows”Four stat cards head the tab — Total Test Cases, Mapped (with coverage %), Unmapped, and Sync Health — followed by a Sync Status Breakdown bar with a drill-down card per status, and a Quick Actions row.
The Dashboard turns the map into reportable numbers. The four stat cards give Total Test Cases, Mapped (with coverage %), Unmapped, and Sync Health.
Checking sync status
Section titled “Checking sync status”Mappings don’t re-validate themselves on every page load. Use Check Sync Status in the Dashboard’s Quick Actions to re-scan all mappings against the current state of the files on disk and refresh every status. Run it after a code change, a refactor, or whenever the health numbers look out of date.
Related
Section titled “Related”- Script Mapping overview — the screen and its tabs.
- Mapped Test Cases tab — manage existing links.
- Map Test Cases tab — create new links.
- Coverage — the wider coverage picture.