

Automation Usage
The Automation Usage tab of the Analytics screen.
This tab answers how much of our testing is automated vs done by hand? It aggregates across every executed cycle.
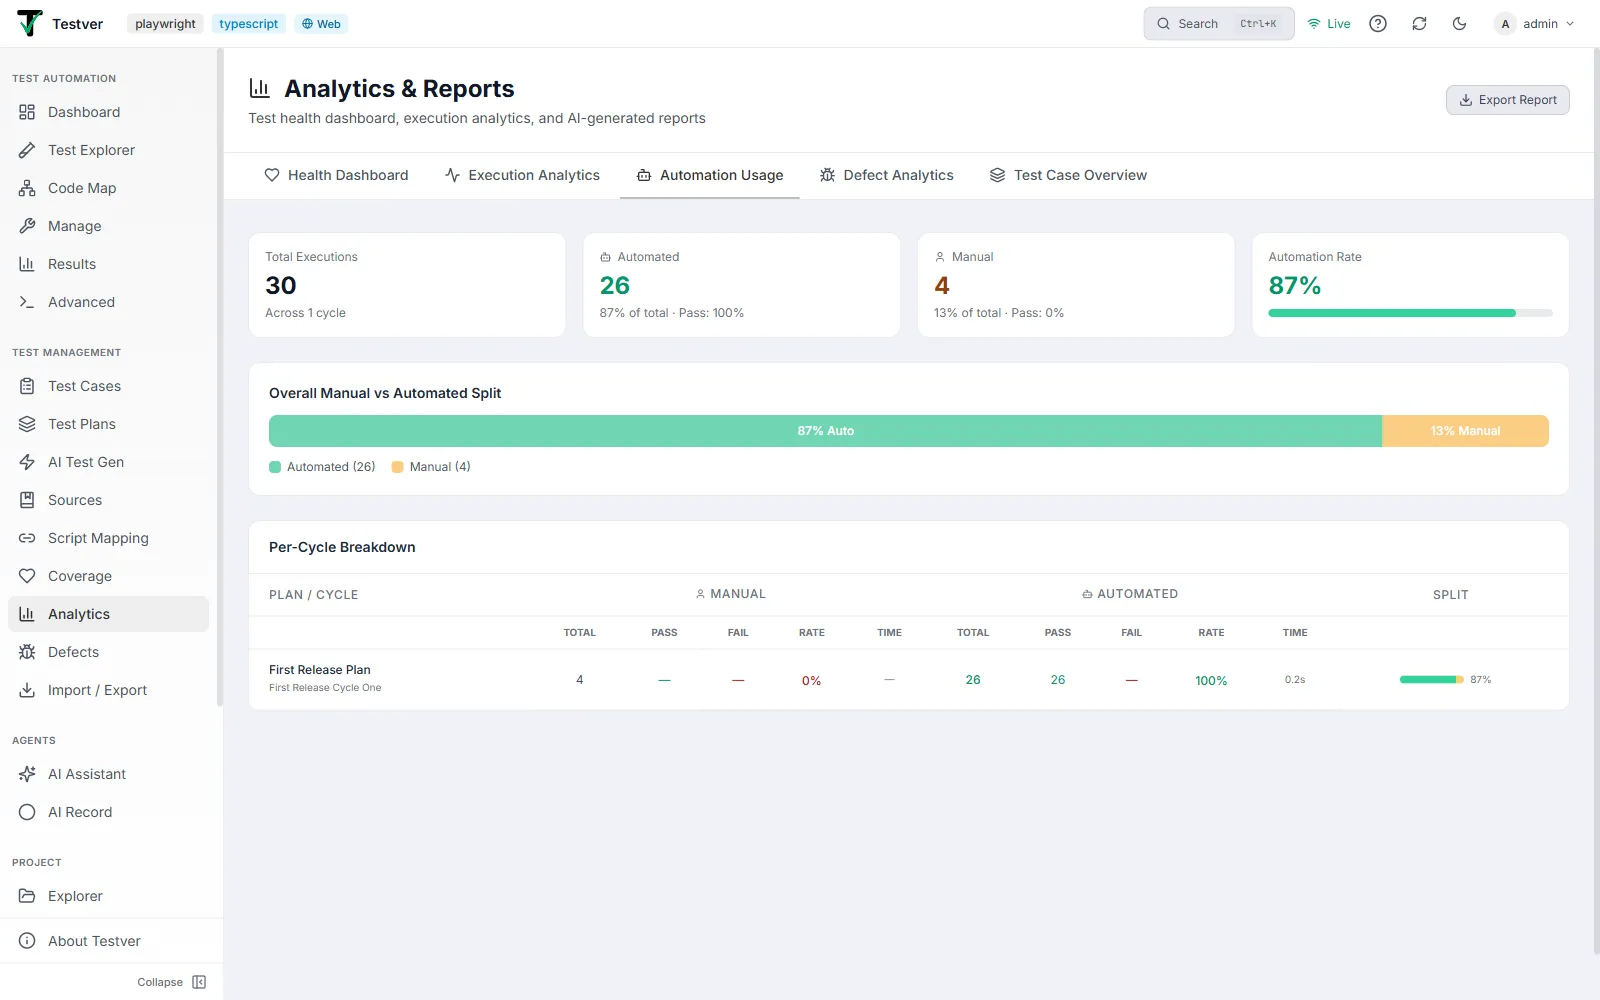
Summary metrics
Section titled “Summary metrics”| Metric | Meaning |
|---|---|
| Total Executions | Combined manual + automated executions, with a sub-line Across N cycles. |
| Automated | Automated execution count, with percentage of total and the automated pass rate. |
| Manual | Manual execution count, with percentage of total and the manual pass rate. |
| Automation Rate | Automated share of total executions, shown as a percentage with a green progress bar. |
Manual vs Automated split
Section titled “Manual vs Automated split”A single wide bar split into a green Automated portion and an amber Manual portion. Each portion shows its percentage inline when it is wider than 10%. A legend beneath gives the raw automated and manual counts.
Per-cycle breakdown
Section titled “Per-cycle breakdown”One row per executed cycle. The header groups columns under Manual and Automated, each with the same five sub-columns, plus a final Split column:
| Column | Meaning |
|---|---|
| Plan / Cycle | Plan name (bold) with the cycle name beneath. |
| Manual: Total / Pass / Fail / Rate / Time | Manual execution count, passes, failures, pass-rate % (green >=80, amber >=50, red below) and total manual run time. |
| Automated: Total / Pass / Fail / Rate / Time | The same five figures for automated executions. |
| Split | A mini bar (green automated vs amber manual) plus the automated percentage for that cycle. |
Related
Section titled “Related”- Analytics overview — the screen and its tabs.