

Defect Analytics
The Defect Analytics tab of the Analytics screen.
This tab summarises the defects logged in Testver. All figures (severity, status, resolution time, trend) are computed from the raw defect list in the browser.
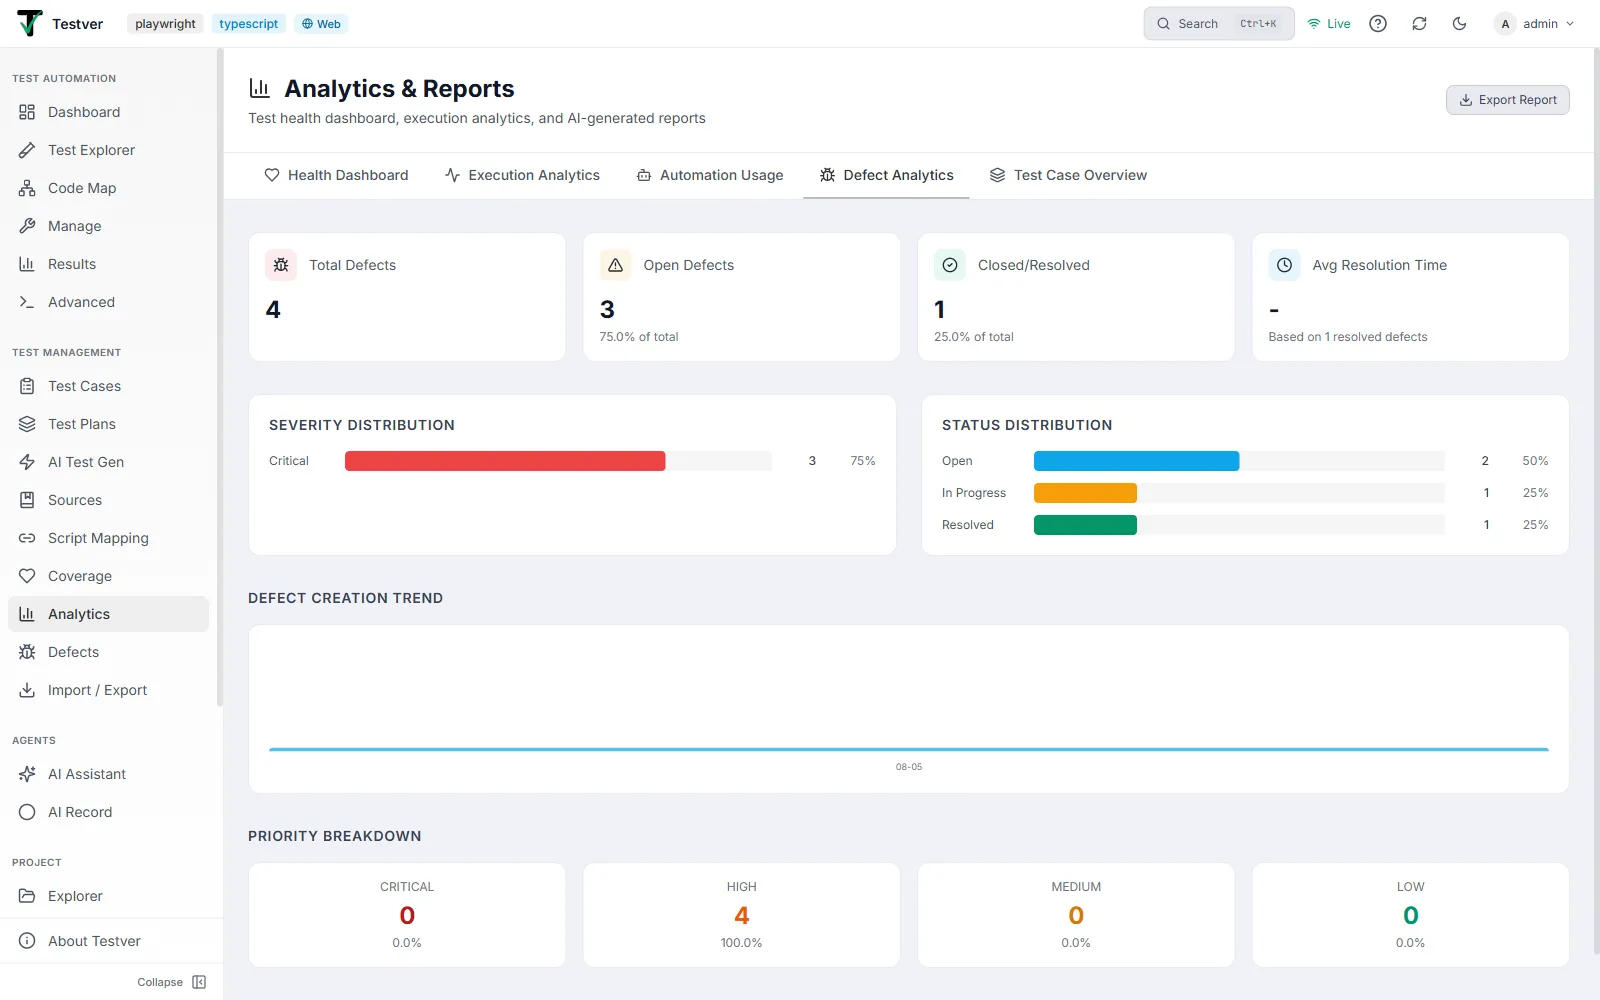
Summary metrics
Section titled “Summary metrics”| Metric | Meaning |
|---|---|
| Total Defects | Count of all defects. |
| Open Defects | Defects in status open, in_progress or reopened, with their share of the total. |
| Closed/Resolved | Defects in status closed, resolved or verified, with their share of the total. |
| Avg Resolution Time | Average hours from creation to resolution, with a sub-line noting how many resolved defects it is based on (the practical MTTR). |
Severity & Status Distribution
Section titled “Severity & Status Distribution”Two side-by-side panels of horizontal bars. Severity Distribution lists critical, blocker, high, medium and low (each with its own colour, count and percentage). Status Distribution lists every status present, sorted by count, with colour-coded bars (e.g. open=blue, in_progress=amber, resolved=green, closed=grey, reopened=red, deferred=violet).
Defect Creation Trend
Section titled “Defect Creation Trend”A vertical bar chart of the last 14 days by defect creation date. Each blue bar is one day; hover for a tooltip reading date: total (X open, Y closed). Every other day is labelled on the x-axis.
Priority Breakdown
Section titled “Priority Breakdown”Four compact cards - Critical (red), High (orange), Medium (amber), Low (green) - each showing the defect count and its percentage of the total.
Related
Section titled “Related”- Analytics overview — the screen and its tabs.