

Test Case Overview
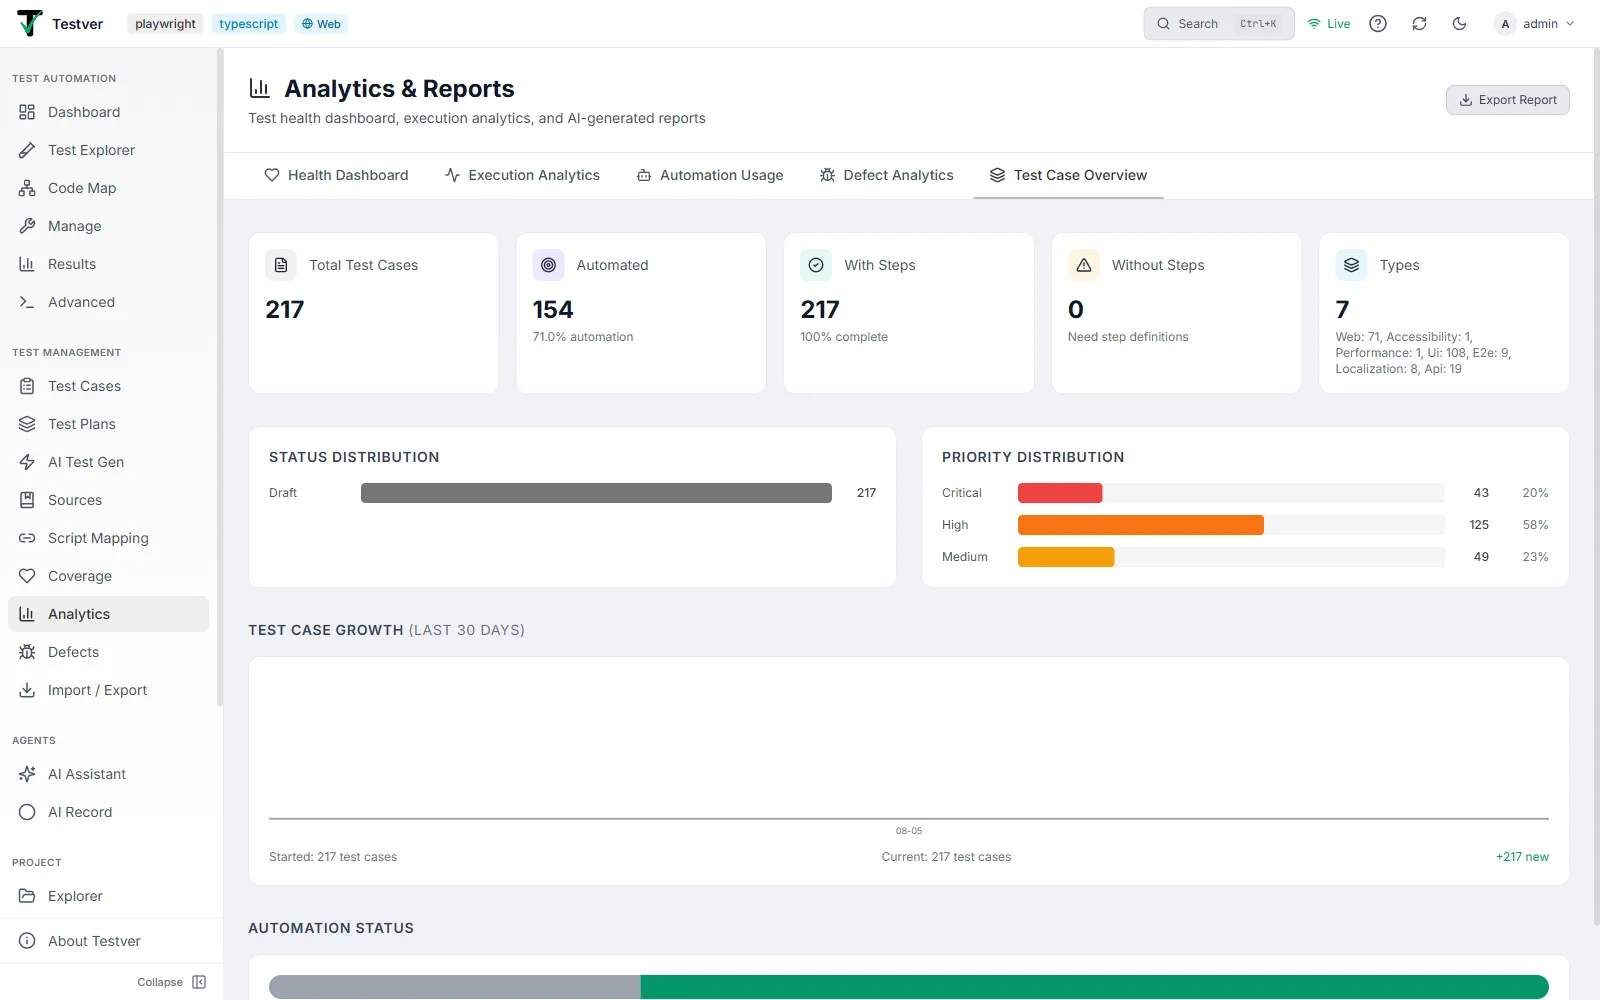
The Test Case Overview tab of the Analytics screen.
This tab describes the composition of your test-case library: how many there are, their statuses, priorities, types, completeness and growth over time.
Summary metrics
Section titled “Summary metrics”| Metric | Meaning |
|---|---|
| Total Test Cases | Count of all test cases. |
| Automated | Number of automated test cases, with the overall automation percentage. |
| With Steps | Test cases that have at least one defined step, with a completeness percentage. |
| Without Steps | Test cases lacking step definitions (flagged as needing work). |
| Types | How many distinct test-case types exist, with a breakdown listed in the sub-line. |
Status & Priority Distribution
Section titled “Status & Priority Distribution”Two side-by-side bar panels. Status Distribution sorts statuses by count (brand-coloured bars). Priority Distribution lists critical (red), high (orange), medium (amber) and low (green) with counts and percentages.
Test Case Growth
Section titled “Test Case Growth”A cumulative area-style bar chart over the last 30 days, where each bar’s height is the running total of test cases up to that day. Hover any bar for date: +N (Total: running total). The footer summarises Started, Current and total new test cases added in the window.
Automation Status
Section titled “Automation Status”A single stacked bar split by automation state - Automated (green), Manual (grey), In Progress (amber) and Planned (blue) - with a legend showing each state’s count and percentage.
Related
Section titled “Related”- Analytics overview — the screen and its tabs.