

Execution Analytics
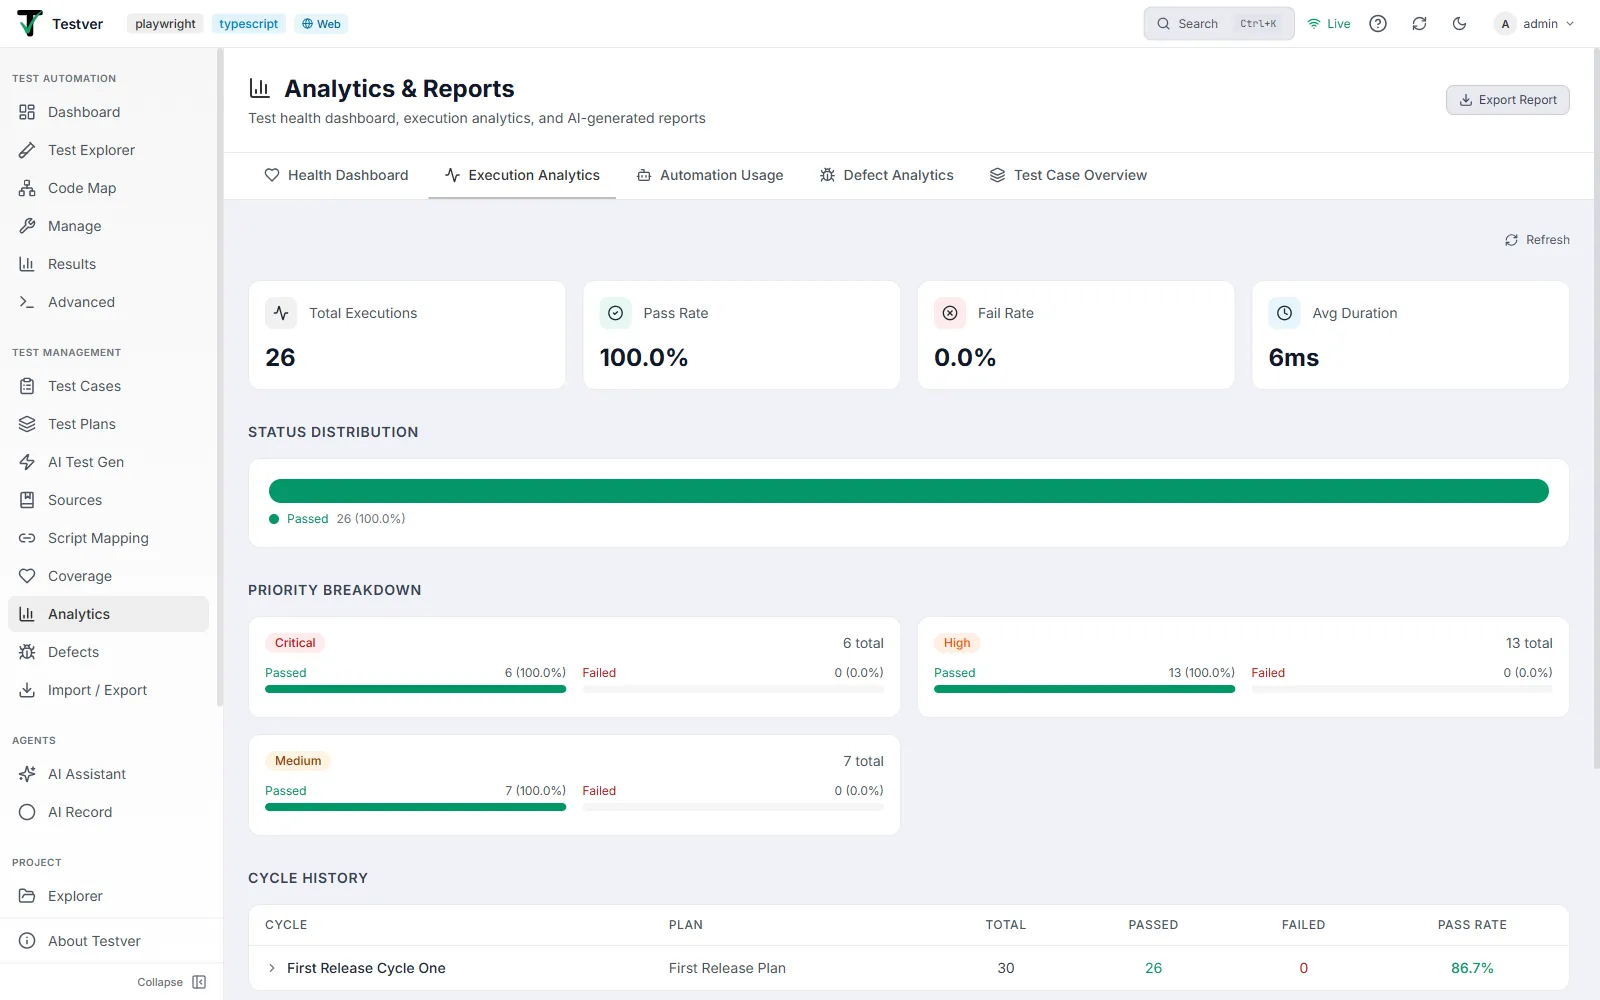
The Execution Analytics tab of the Analytics screen.
This tab is about test runs: how many, how often they pass, how long they take, and which tests are unreliable. It also has a Refresh link.
Summary metrics
Section titled “Summary metrics”| Metric | Meaning |
|---|---|
| Total Executions | Count of all test executions recorded (thousands separators applied). |
| Pass Rate | Percentage of executions that passed, to one decimal place. |
| Fail Rate | Percentage of executions that failed, to one decimal place. |
| Avg Duration | Mean execution time, formatted as ms, seconds (e.g. 4.2s) or minutes+seconds (e.g. 1m 12s). |
Status Distribution
Section titled “Status Distribution”A single horizontal stacked bar split by execution status. Each segment is colour-coded and a legend beneath lists each status with its count and percentage. Hovering a segment shows the same detail as a tooltip.
| Status | Colour |
|---|---|
| Passed | Green |
| Failed | Red |
| Blocked | Amber |
| Skipped | Grey |
Priority Breakdown
Section titled “Priority Breakdown”Up to four cards - Critical, High, Medium, Low (priorities with zero executions are hidden). Each card shows the total for that priority plus side-by-side Passed (green) and Failed (red) bars with counts and percentages.
Cycle History
Section titled “Cycle History”A table of recent test cycles. Columns: Cycle, Plan, Total, Passed, Failed and Pass Rate (green/amber/red by the same 75/50 thresholds). Click any row to expand it: the expanded panel shows a mini distribution bar (passed / failed / blocked / skipped / in-progress) and a stats line with counts and percentages. Click again to collapse.
Execution Trend
Section titled “Execution Trend”A vertical bar chart of the last 14 days of executions. Each bar is a day, stacked by Passed (green), Failed (red) and Other (grey). Bar height is proportional to that day’s total relative to the busiest day. Hover a bar for a tooltip reading date: N total (P passed / F failed). Every other day is labelled along the x-axis, and the caption notes Last N days.
Flaky Tests
Section titled “Flaky Tests”Lists tests that pass sometimes and fail other times, sorted by Flaky Score descending. Columns: Test Title, Flaky Score (a small bar plus the percentage), Passed (green) and Failed (red). The score bar is red at >=60%, amber at >=30% and grey below - the redder the row, the more attention that test needs.
Related
Section titled “Related”- Analytics overview — the screen and its tabs.